

Posted October 2025
August 2025 highlights
In August, the not seasonally adjusted monthly unemployment rate remained unchanged at 5.2%. Total nonfarm employment decreased by 60 jobs in Stevens County from August 2024.
Summary
Stevens County is located near the northeast corner of Washington state. It is part of the Spokane-Spokane Valley Metropolitan Statistical Area, which also includes Spokane County. Stevens County contains most of the Spokane Indian Reservation (237.5 square miles). The county has more than 49,015 residents as of 2024, and 25.9% of the population is age 65 years and over.
Stevens County was historically a top silver and copper producer from the 1850’s to 1910. Forest products also played a major role. Its economy has diversified over the past 20 years, shifting from resource extraction to service-providing jobs and manufacturing. Stevens County has higher unemployment rates and lower labor force participation rates compared to the state averages.
Recovery from the last recession has been slow, with recent job increases. Growth has been driven by demand in housing, recreational markets and machinery manufacturing. Health care employment has grown due to an increase in retirees and changing demographics, especially in assisted care centers. Government is the largest employment sector, accounting for about 30% of total jobs. There are around 978 firms in the county. The 2024 annual average labor force supply was around 18,802 workers with a 6.1% average unemployment rate.
Stevens County geographic overview
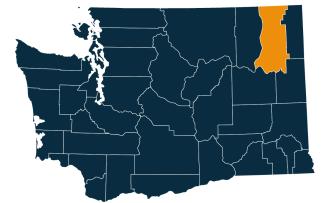
Stevens County is known for its natural beauty and outdoor recreational opportunities. Colville serves as the county seat and is the largest city in Stevens County.
The county spans 2,541 square miles, including 91 square miles of water. Its landscape features forests, mountains and numerous lakes and rivers, offering a variety of recreational activities.
Stevens County was created in 1863 and is named after Isaac Stevens, the first governor of Washington Territory.
Washington has 12 regional Workforce Development Areas. Stevens County is part of Area 10, the Eastern Washington Partnership. Visit the Workforce Training & Education Coordinating Board website for information about the workforce regions.
Stevens County employment situation for August 2025
Monthly labor force and unemployment in Stevens County, Washington
- The not seasonally adjusted unemployment rate was 5.2% during August 2025, down from 5.8% in August 2024.
- The labor force decreased by 197 workers from August 2024 to August 2025.
- The total employed workers decreased by 89 workers from August 2024 to August 2025.
Unemployment rate, not seasonally adjusted
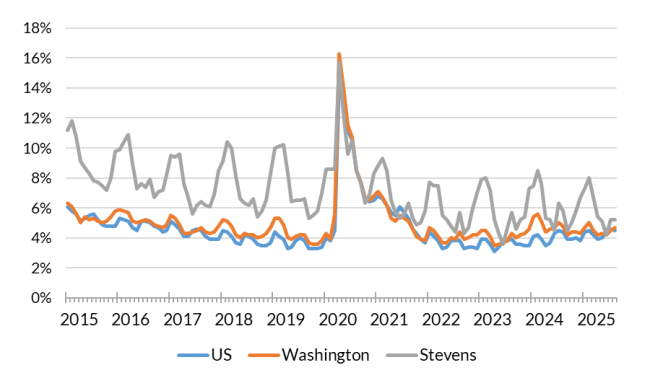
Source: Employment Security Department/Labor Market Information and Research Division, Local area unemployment statistics
Monthly nonfarm payroll employment in Stevens County
-
As of August 2025, total nonfarm employment in Stevens County was 11,420 jobs, a decrease of 110 jobs over the month and a decrease of 60 jobs from August 2024.
- Private sectors, with 8,060 jobs, increased by 20 jobs over the month and increased by 40 jobs from August 2024 to August 2025.
- Goods producing sectors, with 2,000 jobs, increased by 20 jobs over the month and increased by 10 jobs from August 2024.
- Mining, logging and construction, with 860 jobs, increased by 10 jobs over the month but remained unchanged over the year.
- Manufacturing, with 1,140 jobs, increased by 10 jobs over the month but remained unchanged from August 2024.
- Service providing sectors, with 9,430 jobs, decreased by 120 jobs over the month and decreased by 60 jobs from August 2024.
- Retail trade, with 1,260 jobs, decreased by 10 jobs over the month but increased by 20 jobs from August 2024.
- Professional and business services, with 650 jobs, increased by 10 jobs over the month, but decreased by 20 jobs from August 2024.
- Private education and health services, with 1,930 jobs, remained unchanged over the month, but decreased by 30 jobs from August 2024.
- Leisure and hospitality, with 940 jobs, remained unchanged over the month, but increased by 100 jobs from August 2024.
- Government services including public educational services totaled 3,360 jobs, decreased by 130 jobs over the month and decreased by 100 jobs from August 2024.
- From August 2024, federal government has decreased by 30 jobs, state government has decreased by 20 jobs, and local government has decreased by 50 jobs.
Nonfarm employment estimates, not seasonally adjusted, Stevens County
| NAICS Industry Title | Aug 2025 (Prelim) | Jul 2025 (Revised) | Aug 2024 (Revised) | Jul 2025 to Aug 2025 Change | Aug 2024 to Aug 2025 Change | Aug 2024 to Aug 2025 % Change |
|---|---|---|---|---|---|---|
| Total nonfarm | 11,420 | 11,530 | 11,480 | -110 | -60 | -0.5% |
| Total private (total nonfarm less government) | 8,060 | 8,040 | 8,020 | 20 | 40 | 0.5% |
| Goods-producing | 2,000 | 1,980 | 1,990 | 20 | 10 | 0.5% |
| - Mining and logging | 280 | 280 | 290 | 0 | -10 | -3.4% |
| - Construction | 570 | 570 | 570 | 0 | 0 | 0.0% |
| - Manufacturing | 1,140 | 1,130 | 1,140 | 10 | 0 | 0.0% |
| Service-providing | 9,430 | 9,550 | 9,490 | -120 | -60 | -0.6% |
| - Wholesale trade | 240 | 240 | 240 | 0 | 0 | 0.0% |
| - Retail trade | 1,260 | 1,270 | 1,240 | -10 | 20 | 1.6% |
| - Transportation, warehousing, and utilities | 330 | 330 | 380 | 0 | -50 | -13.2% |
| - Information | 70 | 70 | 70 | 0 | 0 | 0.0% |
| - Financial activities | 350 | 350 | 340 | 0 | 10 | 2.9% |
| - Professional and business services | 650 | 640 | 670 | 10 | -20 | -3.0% |
| - Private education and health services | 1,930 | 1,930 | 1,960 | 0 | -30 | -1.5% |
| - Leisure and hospitality | 940 | 940 | 840 | 0 | 100 | 11.9% |
| - Other services | 290 | 290 | 280 | 0 | 10 | 3.6% |
| - Government | 3,360 | 3,490 | 3,460 | -130 | -100 | -2.9% |
Note: Data benchmarked through March 2025, updated September 15, 2025.
Source: Employment Security Department/Labor Market Information and Research Division, Washington employment estimates (WA-QB & CES)
Detailed tables can be found on the source page in the third spreadsheet titled Current employment estimates, not seasonally adjusted.
Total covered employment in Stevens County
Employment by industry, Stevens County 2024 annual average
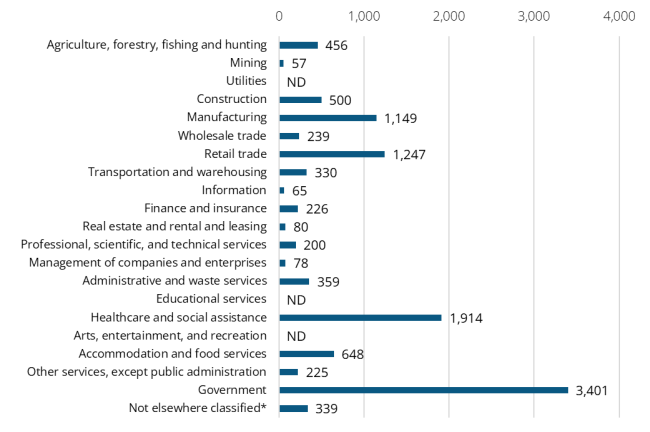
Source: Employment Security Department/Labor Market Information and Research Division, Covered Employment (QCEW)
The average annual covered employment in Stevens County was 11,512 in 2024. Covered employment refers to workers who received wages in Washington state and are eligible for state and federal unemployment insurance (UI) compensation programs.
Wages can vary substantially from one industry sector to another. The average annual wage in Washington state for all industries was $92,467 in 2024. Total covered wages in Stevens County were $612.6 million, with an average annual wage of $53,212 in 2024.
Top sectors by employment in 2024:
- Government (3,401)
- Healthcare and social assistance (1,914)
- Retail trade (1,247)
- Manufacturing (1,149)
- Accommodation and food services (648)
Top sectors by average annual wage in 2024:
- Management of companies and enterprises ($82,998)
- Mining ($75,326)
- Information ($72,328)
- Administrative and waste services ($66,805)
- Finance and insurance ($64,218)
Workforce demographics in Stevens County
The labor force participation rate is highest among the 25 to 29 years age group at 77.1%, while the 65 to 74 age group has the lowest at 22.7%. Participation rate for labor force prime working population 20 to 64 years of age was 66.3%.
Male workers have a slightly higher participation rate (71.5%) compared to female workers (61.1%). Those with a bachelor’s degree or higher have the highest participation rate at 82.0%, while those with less than a high school diploma have the lowest at 47.6%.
Visit the U.S. Census Bureau website for more quick facts about Stevens County.
Age
| Demographic characteristic | Total | Labor force participation rate | Unemployment rate |
|---|---|---|---|
| Population 16 years and over | 38,727 | 49.5% | 5.3% |
| 16 to 19 years | 2,264 | 38.7% | 13.3% |
| 20 to 24 years | 2,051 | 65.0% | 17.3% |
| 25 to 29 years | 2,205 | 77.1% | 5.6% |
| 30 to 34 years | 2,342 | 71.3% | 5.5% |
| 35 to 44 years | 5,152 | 73.4% | 4.1% |
| 45 to 54 years | 5,434 | 74.2% | 4.5% |
| 55 to 59 years | 3,061 | 57.3% | 1.7% |
| 60 to 64 years | 4,501 | 47.5% | 1.8% |
| 65 to 74 years | 7,457 | 22.7% | 3.7% |
| 75 years and over | 4,260 | 4.7% | 4.0% |
Race or Hispanic origin
| Demographic characteristic | Total | Labor force participation rate | Unemployment rate |
|---|---|---|---|
| White alone | 34,067 | 49.2% | 4.4% |
| Black or African American alone | 154 | 52.6% | 38.3% |
| American Indian and Alaska Native alone | 1,410 | 50.4% | 20.1% |
| Asian alone | 389 | 62.7% | 0.0% |
| Native Hawaiian and other Pacific Islander alone | 68 | 60.3% | 7.3% |
| Some other race alone | 492 | 60.4% | 7.4% |
| Two or more races | 2,147 | 48.5% | 6.6% |
| Hispanic or Latino origin (of any race) | 1,302 | 58.4% | 12.6% |
| White alone, not Hispanic or Latino | 33,500 | 49.0% | 4.0% |
| Population 20 to 64 years | 24,746 | 66.3% | 5.0% |
Sex
| Demographic characteristic | Total | Labor force participation rate | Unemployment rate |
|---|---|---|---|
| Male | 12,383 | 71.5% | 5.6% |
| Female | 12,363 | 61.1% | 4.3% |
Females with children
| Demographic characteristic | Total | Labor force participation rate | Unemployment rate |
|---|---|---|---|
| With own children under 18 | 4,229 | 64.5% | 5.4% |
| With own children under 6 only | 831 | 51.0% | 5.2% |
| With own children under 6 and 6 to 17 | 803 | 44.6% | 3.9% |
| With own children 6 to 17 only | 2,595 | 75.0% | 5.7% |
Poverty status in the past 12 months
| Demographic characteristic | Total | Labor force participation rate | Unemployment rate |
|---|---|---|---|
| Below poverty level | 3,201 | 26.7% | 34.2% |
| At or above the poverty level | 21,517 | 72.3% | 3.4% |
Disability status
| Demographic characteristic | Total | Labor force participation rate | Unemployment rate |
|---|---|---|---|
| With any disability | 4,279 | 30.1% | 9.4% |
Educational attainment
| Demographic characteristic | Total | Labor force participation rate | Unemployment rate |
|---|---|---|---|
| Population 25 to 64 years | 22,695 | 66.4% | 3.9% |
| Less than high school graduate | 1,726 | 47.6% | 11.1% |
| High school graduate (includes equivalency) | 7,792 | 60.6% | 4.0% |
| Some college or associate's degree | 8,800 | 67.6% | 4.7% |
| Bachelor's degree or higher | 4,377 | 82.0% | 0.9% |
This workforce product was funded by a grant awarded by the U.S. Department of Labor's Employment and Training Administration. The product was created by the recipient and does not necessarily reflect the official position of the U.S. Department of Labor. The Department of Labor makes no guarantees, warranties, or assurances of any kind, expressed or implied, with respect to such information, including any information on linked sites and including, but not limited to, accuracy of the information or its completeness, timeliness, usefulness, adequacy, continued availability, or ownership. This product is copyrighted by the institution that created it. Internal use by an organization and/or personal use by an individual for non-commercial purposes is permissible. All other uses require the prior authorization of the copyright owner.