

County profiles
Select your county from the drop down below or scroll down for the Washington state profile.
-
Washington counties
Posted October 2025
August 2025 highlights
From July to August, the not seasonally adjusted unemployment rate increased from 4.5% to 4.7% and total nonfarm employment decreased by 24,400.
Washington state summary
The last several years have been interesting. Washington lost 430,000 jobs during the Covid-19 pandemic recession but rebounded quickly, along with the nation. Total nonfarm employment reached pre-pandemic levels by summer 2022. Within that, some industries, such as information, recovered within months of the crisis. Others, such as manufacturing, remain below pre-pandemic employment levels five years later.
The relatively quick jobs recovery led to an exceptionally tight labor market in 2021-2022 as employer demand surged and labor market participation only partially recovered.
2023 and 2024 marked a turning point. The high employment growth characterizing the Covid recovery slowed overall, and employment patterns began to shift. Some notable downward shifts occurred in the information sector that experienced some significant downsizing, and construction.
Over the past several months, growth has more or less paused. A few industries such as health care continue to add jobs, but employment counts in most sectors in 2025 have hovered around or dropped slightly below the levels observed in 2024.
Preliminary estimates in the August 2025 report reveal that nonfarm employment was 0.1% below the level observed 12 months prior.
Geographic overview
Washington is in the Pacific Northwest region of the United States, neighboring Oregon to the south, Idaho to the east, British Columbia, Canada, to the north and the Pacific Ocean to the west.
Washington is part of the U.S. Bureau of Labor Statistics’ west region. It includes the following Metropolitan Statistical Areas (MSAs):
- Seattle-Tacoma-Bellevue MSA
- Seattle-Bellevue MD (part of Seattle-Tacoma-Bellevue MSA)
- Tacoma-Lakewood MD (part of Seattle-Tacoma-Bellevue MSA)
- Everett MD (part of Seattle-Tacoma-Bellevue MSA)
- Olympia-Lacey-Tumwater MSA
- Bremerton-Silverdale-Port Orchard MSA
- Mount Vernon-Anacortes MSA
- Portland (Ore.)-Vancouver (Wash.)-Hillsboro (Ore.) MSA
- Longview MSA
- Spokane-Spokane Valley MSA
- Kennewick-Richland MSA
- Walla Walla MSA
- Yakima MSA
- Bellingham MSA
- Wenatchee MSA
Visit the Bureau of Labor Statistics website for more about information about Washington.
Washington has 12 regional workforce areas overseen by Workforce Development Boards. Visit the Workforce Training & Education Coordinating Board website for information about the 12 regions.
Employment situation for August 2025
Labor force and unemployment
-
The not seasonally adjusted unemployment rate was 4.7% in August 2025, up from 4.5% in July and up from 4.6% observed 12 months ago.
-
The labor force decreased by 0.7% compared to August 2024, shedding 27,056 participants.
-
The number of unemployed Washingtonians was estimated at 188,175 in August 2025.
Unemployment rate, not seasonally adjusted
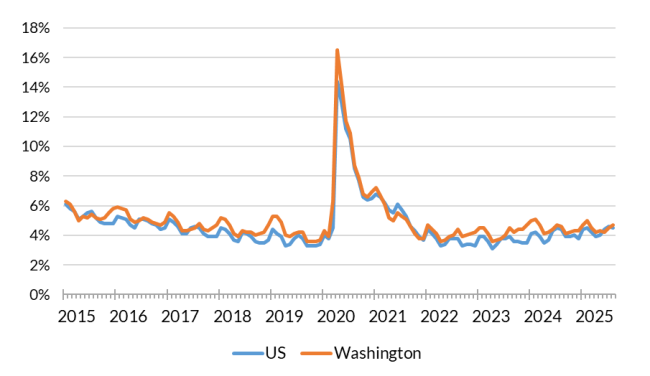
Source: Employment Security Department/Labor Market Information and Research (LMIR) division, Local area unemployment statistics
Payroll employment
-
Total nonfarm employment decreased by 24,400 from July to August 2025.
-
From July to August 2025, not seasonally adjusted employment increased for three sectors detailed in this report and decreased for ten. The three sectors that added jobs were construction (up 1,500), private education and health services (up 1,400) and other services (up 600). The deepest losses were observed in government (down 14,000), manufacturing (down 4,000) and professional and business services (down 2,400).
-
From August 2024 to August 2025, total nonfarm employment decreased by 5,400 or 0.1%.
-
Overall, employment in four major industries expanded and nine contracted over the year.
-
Employment in private education and health services increased to the greatest extent (up 19,300), followed by transportation, warehousing and utilities (up 5,200) and leisure and hospitality (up 4,700). The largest decreases over the year were in professional and business services (down 18,400), government (down 6,800) and retail trade (down 3,700).
Nonfarm employment estimates, not seasonally adjusted, Washington state
| NAICS Industry Title | Aug 2025 (Prelim) | Jul 2025 (Revised) | Aug 2024 (Revised) | Jul 2025 to Aug 2025 Change | Aug 2024 to Aug 2025 Change | Aug 2024 to Aug 2025 % Change |
|---|---|---|---|---|---|---|
| Total nonfarm | 3,644,900 | 3,669,300 | 3,650,300 | -24,400 | -5,400 | -0.1% |
| Total private (total nonfarm less government) | 3,057,900 | 3,068,300 | 3,056,500 | -10,400 | 1,400 | 0.0% |
| Goods-producing | 511,900 | 514,500 | 516,000 | -2,600 | -4,100 | -0.8% |
| - Mining and logging | 5,000 | 5,100 | 5,400 | -100 | -400 | -7.4% |
| - Construction | 230,500 | 229,000 | 231,000 | 1,500 | -500 | -0.2% |
| - Manufacturing | 276,400 | 280,400 | 279,600 | -4,000 | -3,200 | -1.1% |
| Service-providing | 3,133,000 | 3,154,800 | 3,134,300 | -21,800 | -1,300 | 0.0% |
| - Wholesale trade | 138,300 | 139,800 | 138,500 | -1,500 | -200 | -0.1% |
| - Retail trade | 331,900 | 332,800 | 335,600 | -900 | -3,700 | -1.1% |
| - Transportation, warehousing, and utilities | 158,600 | 159,600 | 153,400 | -1,000 | 5,200 | 3.4% |
| - Information | 165,100 | 166,900 | 166,900 | -1,800 | -1,800 | -1.1% |
| - Financial activities | 161,500 | 161,800 | 164,700 | -300 | -3,200 | -1.9% |
| - Professional and business services | 534,100 | 536,500 | 552,500 | -2,400 | -18,400 | -3.3% |
| - Private education and health services | 561,500 | 560,100 | 542,200 | 1,400 | 19,300 | 3.6% |
| - Leisure and hospitality | 367,300 | 369,200 | 362,600 | -1,900 | 4,700 | 1.3% |
| - Other services | 127,700 | 127,100 | 124,100 | 600 | 3,600 | 2.9% |
| - Government | 587,000 | 601,000 | 593,800 | -14,000 | -6,800 | -1.1% |
Note: Data benchmarked through March 2025, updated September11, 2025.
Source: Employment Security Department/Labor Market Information and Research division, Washington employment estimates (WA-QB & CES)
Detailed tables can be found on the source page in the third spreadsheet titled current employment estimates, not seasonally adjusted.
Total covered employment
Washington has a diverse labor market with substantial local variation. Government is the largest sector in terms of employment, which includes federal, state and local government and activities ranging from administration to public education, public utilities, tribal enterprise and more. The largest private sector industries are healthcare and social assistance, retail trade and manufacturing.
Employment by industry, Washington state 2024 annual average
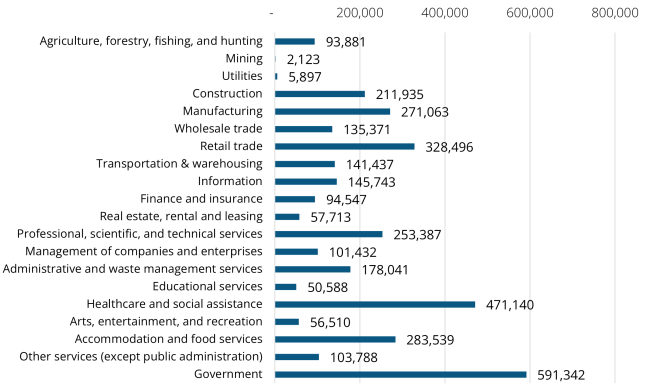
Source: Employment Security Department/Labor Market Information and Research (LMIR) division, Covered Employment (QCEW)
Average annual covered employment in Washington was 3,577,071 and the average annual wage was $92,467 in 2024.
Top five sectors in terms of employment in 2024:
-
Government (591,342)
-
Health care and social assistance (471,140)
-
Retail trade (328,496)
-
Accommodation and food services (283,539)
-
Manufacturing (271,063)
Wages can vary substantially from one industry sector to another.
Top five sectors in terms of average annual wages in 2024:
-
Management of companies and enterprises ($276,463)
-
Information ($275,718)
-
Professional, scientific and technical services ($147,450)
-
Utilities ($136,763)
-
Finance and insurance ($134,545)
Workforce demographics for Washington state
Age
| Total | Labor force participation rate | Unemployment rate | |
|---|---|---|---|
| 16 to 19 years | 365,567 | 40.20% | 16.60% |
| 20 to 24 years | 477,787 | 79.20% | 8.80% |
| 25 to 29 years | 566,940 | 84.90% | 5.10% |
| 30 to 34 years | 606,494 | 83.40% | 4.70% |
| 35 to 44 years | 1,092,809 | 83.30% | 4.10% |
| 45 to 54 years | 934,040 | 82.30% | 3.50% |
| 55 to 59 years | 460,694 | 74.60% | 3.80% |
| 60 to 64 years | 488,857 | 58.60% | 3.50% |
| 65 to 74 years | 772,064 | 24.80% | 3.60% |
| 75 years and over | 487,249 | 5.90% | 3.80% |
| Population 16 years and over | 6,252,501 | 64.70% | 5.00% |
| Population 20 to 64 years | 4,627,621 | 79.40% | 4.60% |
| Population 25 to 64 years | 4,149,834 | 79.50% | 4.10% |
Race and Hispanic or Latino origin
| Total | Labor force participation rate | Unemployment rate | |
|---|---|---|---|
| White alone | 4,394,285 | 62.30% | 4.70% |
| Black or African American alone | 241,312 | 69.70% | 7.40% |
| American Indian and Alaska Native alone | 69,995 | 61.00% | 8.10% |
| Asian alone | 613,005 | 70.10% | 3.50% |
| Native Hawaiian and other Pacific Islander alone | 41,512 | 69.40% | 6.10% |
| Some other race alone | 312,691 | 73.10% | 5.60% |
| Two or more races | 579,701 | 70.00% | 6.80% |
| Hispanic or Latino origin (of any race) | 742,087 | 72.90% | 5.90% |
| White alone, not Hispanic or Latino | 4,213,100 | 61.90% | 4.70% |
Sex
| Total | Labor force participation rate | Unemployment rate | |
|---|---|---|---|
| Male | 2,368,049 | 84.70% | 4.70% |
| Female | 2,259,572 | 73.90% | 4.50% |
Females with children
| Total | Labor force participation rate | Unemployment rate | |
|---|---|---|---|
| children under 18 | 779,573 | 71.90% | 4.30% |
| children under 6 only | 183,193 | 68.60% | 4.70% |
| children under 6 and 6 to 17 | 157,076 | 61.80% | 5.60% |
| children 6 to 17 only | 439,304 | 76.80% | 3.70% |
Poverty status over the past 12 months
| Total | Labor force participation rate | Unemployment rate | |
|---|---|---|---|
| Below poverty level | 430,738 | 45.00% | 22.10% |
| At or above the poverty level | 4,140,197 | 83.60% | 3.60% |
Disability status
| Total | Labor force participation rate | Unemployment rate | |
|---|---|---|---|
| With any disability | 501,627 | 50.60% | 10.00% |
Educational attainment
| Total | Labor force participation rate | Unemployment rate | |
|---|---|---|---|
| Less than high school graduate | 326,059 | 66.10% | 7.10% |
| High school graduate (includes equivalency) | 886,366 | 73.50% | 5.50% |
| Some college or associate's degree | 1,288,226 | 77.80% | 4.50% |
| Bachelor's degree or higher | 1,649,183 | 86.60% | 2.80% |
Source: U.S. Census Bureau, American Community Survey, S2301 | Employment Status
This workforce product was funded by a grant awarded by the U.S. Department of Labor's Employment and Training Administration. The product was created by the recipient and does not necessarily reflect the official position of the U.S. Department of Labor. The Department of Labor makes no guarantees, warranties, or assurances of any kind, expressed or implied, with respect to such information, including any information on linked sites and including, but not limited to, accuracy of the information or its completeness, timeliness, usefulness, adequacy, continued availability, or ownership. This product is copyrighted by the institution that created it. Internal use by an organization and/or personal use by an individual for non-commercial purposes is permissible. All other uses require the prior authorization of the copyright owner.