

Posted October 2025
August 2025 highlights
In August, the not seasonally adjusted monthly unemployment rate decreased from 5.8% to 5.5%. Total nonfarm employment decreased by 160 jobs in Grant County from August 2024.
Summary
Grant County has a labor supply of 46,644 workers as of August 2025 and the not seasonally adjusted unemployment rate is 5.5%. Nonfarm employment in Grant County was 34,840 in August 2025, a decrease of 160 jobs from August 2024 but an increase of 230 jobs from July 2025. Agriculture, forestry and fishing make up the largest industry sector with an annual average employment of 9,326 out of 43,169 total annual average employment in 2024. The county has 2,522 establishments. Grant County’s 16 and older population was 75,012 in 2023.
Geography
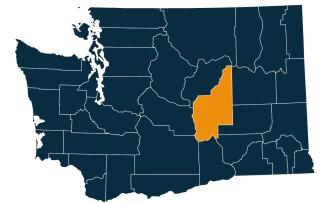
Grant County is in central Washington. The county has a large lake where it’s largest city, Moses Lake, surrounds it and takes the name.
Employment situation for August 2025
Labor force and unemployment
- The not seasonally adjusted unemployment rate was 5.5% during August 2025, up from 5.2% in August 2024.
- The August 2025 labor force of 46,644 workers decreased by 813 from August 2024.
- The total number of employed workers was 44,078, a decrease of 914 workers from August 2024 to August 2025.
Unemployment rate, not seasonally adjusted
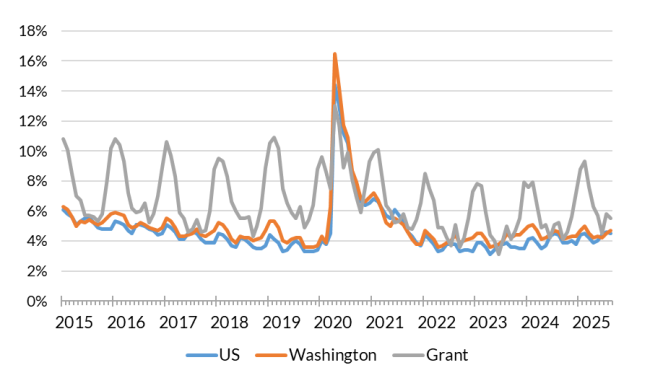
Source: Employment Security Department/Labor Market Information and Research Division, Local area unemployment statistics
Payroll employment
- Nonfarm employment in Grant County was 34,840 in August 2025, a decrease of 160 jobs from August 2024 but an increase of 230 jobs from July 2025.
- Manufacturing increased by 30 jobs from July 2025 to August 2025 and increased by 280 jobs from August 2024.
- Construction increased by 60 jobs from August 2024 to August 2025 and increased by 100 jobs over the month.
- Professional and business services decreased by 70 jobs from August 2024 to August 2025 but increased by 10 jobs over the month.
- Health care and social assistance decreased by 180 jobs from August 2024 to August 2025 but remained unchanged over the month.
- Leisure and hospitality decreased by 230 jobs from August 2024 to August 2025 but increased by 70 jobs over the month.
- The government sector increased by 30 jobs from August 2024 to August 2025 and increased by 50 jobs over the month.
Nonfarm employment estimates, not seasonally adjusted, Grant County
| NAICS Industry Title | Aug 2025 (Prelim) | Jul 2025 (Revised) | Aug 2024 (Revised) | Jul 2025 to Aug 2025 Change | Aug 2024 to Aug 2025 Change | Aug 2024 to Aug 2025 % Change |
|---|---|---|---|---|---|---|
| Total nonfarm | 34,840 | 34,610 | 35,000 | 230 | -160 | -0.5% |
| Total private (total nonfarm less government) | 25,780 | 25,590 | 25,960 | 190 | -180 | -0.7% |
| Goods-producing | 6,900 | 6,780 | 6,550 | 120 | 350 | 5.3% |
| - Mining and logging | 50 | 50 | 50 | 0 | 0 | 0.0% |
| - Construction | 1,900 | 1,800 | 1,840 | 100 | 60 | 3.3% |
| - Manufacturing | 4,950 | 4,920 | 4,670 | 30 | 280 | 6.0% |
| Service-providing | 27,940 | 27,830 | 28,450 | 110 | -510 | -1.8% |
| - Wholesale trade | 2,050 | 2,030 | 2,030 | 20 | 20 | 1.0% |
| - Retail trade | 3,570 | 3,590 | 3,590 | -20 | -20 | -0.6% |
| - Transportation, warehousing, and utilities | 1,240 | 1,240 | 1,250 | 0 | -10 | -0.8% |
| - Information | 660 | 680 | 710 | -20 | -50 | -7.0% |
| - Financial activities | 850 | 830 | 830 | 20 | 20 | 2.4% |
| - Professional and business services | 3,370 | 3,360 | 3,440 | 10 | -70 | -2.0% |
| - Private education and health services | 3,370 | 3,370 | 3,530 | 0 | -160 | -4.5% |
| - Leisure and hospitality | 3,070 | 3,000 | 3,300 | 70 | -230 | -7.0% |
| - Other services | 700 | 700 | 710 | 0 | -10 | -1.4% |
| - Government | 9,070 | 9,020 | 9,040 | 50 | 30 | 0.3% |
Note: Data benchmarked through March 2025, updated September 15, 2025.
Source: Employment Security Department/Labor Market Information and Research Division, Washington employment estimates (WA-QB & CES)
Detailed tables can be found on the source page in the third spreadsheet titled Current employment estimates, not seasonally adjusted.
Industry employment (covered employment)
Employment by industry, Grant County 2024 annual average
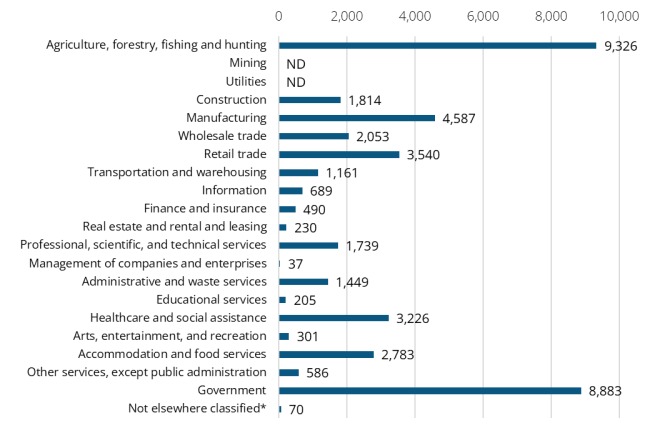
Source: Employment Security Department/Labor Market Information and Research Division, Covered Employment (QCEW)
Average annual covered employment in 2024 in Grant County was 43,169. Covered employment refers to workers who received wages in Washington state and are eligible for state and federal unemployment insurance (UI) compensation programs.
Top sectors in terms of employment in 2024:
- Agriculture, forestry and fishing (9,326 jobs)
- Government (8,883 jobs)
- Manufacturing (4,587 jobs)
- Retail trade (3,540 jobs)
- Healthcare and social assistance (3,226 jobs)
Wages vary by industry sector. The average annual wage in Grant County was $63,542, which was 68.7% of Washington state’s average annual wage of $92,467.
Top five sectors in terms of total wages paid in 2024:
- Government ($685.5 million)
- Agriculture, forestry and fishing ($387.8 million)
- Manufacturing ($342.9 million)
- Professional and business services ($255 million)
- Wholesale trade ($193.6 million)
Workforce demographics for Grant County
Grant County’s 16 and older population was 75,012 in 2023. The labor force participation rate in Grant County was 63.3% with an average unemployment rate of 6.9%.
Visit the U.S. Census Bureau website for more quick facts about Grant County.
Age
| Demographic characteristic | Total | Labor force participation rate | Unemployment rate |
|---|---|---|---|
| Population 16 years and over | 75,012 | 62.6% | 6.3% |
| 16 to 19 years | 6,418 | 44.4% | 12.3% |
| 20 to 24 years | 6,605 | 77.7% | 14.2% |
| 25 to 29 years | 6,945 | 82.4% | 4.0% |
| 30 to 34 years | 6,781 | 78.9% | 2.9% |
| 35 to 44 years | 12,116 | 81.8% | 4.2% |
| 45 to 54 years | 10,846 | 81.3% | 5.4% |
| 55 to 59 years | 5,289 | 71.8% | 8.9% |
| 60 to 64 years | 5,619 | 53.4% | 7.0% |
| 65 to 74 years | 8,714 | 22.4% | 3.3% |
| 75 years and over | 5,679 | 7.7% | 0.0% |
Race or Hispanic origin
| Demographic characteristic | Total | Labor force participation rate | Unemployment rate |
|---|---|---|---|
| White alone | 46,100 | 57.3% | 5.7% |
| Black or African American alone | 903 | 55.5% | 8.8% |
| American Indian and Alaska Native alone | 1,239 | 67.2% | 10.5% |
| Asian alone | 946 | 78.4% | 15.2% |
| Native Hawaiian and other Pacific Islander alone | 18 | 27.8% | 0.0% |
| Some other race alone | 15,352 | 73.1% | 6.0% |
| Two or more races | 10,454 | 69.4% | 7.5% |
| Hispanic or Latino origin (of any race) | 28,585 | 74.0% | 6.5% |
| White alone, not Hispanic or Latino | 41,058 | 55.4% | 6.0% |
| Population 20 to 64 years | 54,201 | 77.0% | 6.1% |
Sex
| Demographic characteristic | Total | Labor force participation rate | Unemployment rate |
|---|---|---|---|
| Male | 28,198 | 82.6% | 6.4% |
| Female | 26,003 | 70.9% | 5.7% |
Females with children
| Demographic characteristic | Total | Labor force participation rate | Unemployment rate |
|---|---|---|---|
| With own children under 18 | 10,978 | 73.0% | 3.9% |
| With own children under 6 only | 1,928 | 67.6% | 1.5% |
| With own children under 6 and 6 to 17 | 3,457 | 65.5% | 5.6% |
| With own children 6 to 17 only | 5,593 | 79.5% | 3.8% |
Poverty status in the past 12 months
| Demographic characteristic | Total | Labor force participation rate | Unemployment rate |
|---|---|---|---|
| Below poverty level | 7,811 | 50.2% | 20.8% |
| At or above the poverty level | 46,207 | 81.8% | 4.6% |
Disability status
| Demographic characteristic | Total | Labor force participation rate | Unemployment rate |
|---|---|---|---|
| With any disability | 6,934 | 43.6% | 10.7% |
Educational attainment
| Demographic characteristic | Total | Labor force participation rate | Unemployment rate |
|---|---|---|---|
| Population 25 to 64 years | 47,596 | 76.9% | 5.0% |
| Less than high school graduate | 9,348 | 72.8% | 5.5% |
| High school graduate (includes equivalency) | 13,532 | 74.0% | 4.7% |
| Some college or associate's degree | 15,901 | 77.1% | 3.0% |
| Bachelor's degree or higher | 8,815 | 85.2% | 8.2% |
Source: U.S. Census Bureau, American Community Survey 5-year estimates, S2301 | Employment Status
This workforce product was funded by a grant awarded by the U.S. Department of Labor's Employment and Training Administration. The product was created by the recipient and does not necessarily reflect the official position of the U.S. Department of Labor. The Department of Labor makes no guarantees, warranties, or assurances of any kind, expressed or implied, with respect to such information, including any information on linked sites and including, but not limited to, accuracy of the information or its completeness, timeliness, usefulness, adequacy, continued availability, or ownership. This product is copyrighted by the institution that created it. Internal use by an organization and/or personal use by an individual for non-commercial purposes is permissible. All other uses require the prior authorization of the copyright owner.