

August 2025 highlights
The unemployment rate in the county was 4.5% in August 2025, which increased from 4.3% in July 2025 and recorded a decrease from 4.8% in August 2024. Overall job trends show Kittitas County had total nonfarm employment of 16,850 jobs, reflecting a 0.5% increase, with 80 new jobs compared to August 2024.
Summary
Kittitas County’s economy remains diverse, with key contributions from government, education, retail trade, leisure and hospitality and manufacturing. While the county is known for its agricultural heritage, government employment continues to be the largest sector, averaging 4,557 jobs annually.
Retail trade and leisure and hospitality sectors have shown consistent growth. Workforce development initiatives continue to emphasize skill enhancement in education, retail and construction, ensuring a competitive local workforce. Economic diversification efforts include support for small businesses and promotion of tourism, leveraging the county’s scenic beauty and outdoor recreation assets.
Geography
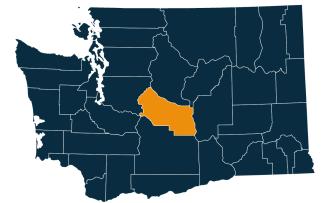
Kittitas County is in the center of the state, 107 miles east of Seattle. It is nestled between the Cascade Mountains to the west and the Columbia River to the east. With 2,297.3 square miles, it is the eighth largest county in Washington by land area.
Employment situation for August 2025
Labor force and unemployment
-
As of August 2025, Kittitas County total labor force and employment increased, while unemployment decreased since August 2024.
-
Kittitas County has more than 21,274 people in the labor force, with an increase of 0.4% or 84 workers from August 2024, while employed workforce increased by 0.7% or 141 workers and unemployed workers decreased by 5.6% or 57 workers. About 965 people were unemployed and looking for work.
-
The unemployment rate in the county was 4.5% in August 2025, which increased from 4.3% in July 2025 and recorded a decrease from 4.8% in August 2024.
Unemployment rate, not seasonally adjusted

Source: Employment Security Department/Labor Market Information and Research Division, Local area unemployment statistics
Payroll employment
-
Overall job trends show Kittitas County had total nonfarm employment of 16,850 jobs, reflecting a 0.5% increase, with 80 new jobs compared to August 2024. The private sector increased by 130 jobs (1.1%), while government employment decreased by 60 jobs (1.1 %) year-over-year.
-
Industries with growth include construction with 3.4% or 50 jobs increase, followed by retail trade with an increase of 100 jobs or 5.5%. Utilities industry increased by 10 jobs or 20.0%, year-over-year. Professional and business services each increased by 40 jobs (4.7%). Private education and health services increased by 20 jobs (1.2%).
-
Industries facing declines include the other services industry cluster, which decreased by 10 jobs or 2.3%, leisure and hospitality, which dropped by 0.7%, shedding 20 jobs, financial activities, which decreased by 10 jobs or 2.6%, transportation, warehousing and utilities, which declined by 10 jobs or 3.4%, the wholesale trade industry, which decreased by 10 jobs or 1.9%, year-over-year and manufacturing, losing 1.5% or (10 jobs).
-
Government employment, with total of 5,330 jobs, decreased over the year by 60 jobs (1.1%), while state government declined by 2.9% or 70 jobs. Local and federal government remained unchanged year-over-year.
Nonfarm employment estimates, not seasonally adjusted, Kittitas County
| NAICS Industry Title | Aug 2025 (Prelim) | Jul 2025 (Revised) | Aug 2024 (Revised) | Jul 2025 to Aug 2025 Change | Aug 2024 to Aug 2025 Change | Aug 2024 to Aug 2025 % Change |
|---|---|---|---|---|---|---|
| Total nonfarm | 16,850 | 17,070 | 16,770 | -220 | 80 | 0.5% |
| Total private (total nonfarm less government) | 11,520 | 11,580 | 11,390 | -60 | 130 | 1.1% |
| Goods-producing | 2,160 | 2,210 | 2,140 | -50 | 20 | 0.9% |
| - Mining and logging | 20 | 20 | 30 | 0 | -10 | -33.3% |
| - Construction | 1,500 | 1,550 | 1,450 | -50 | 50 | 3.4% |
| - Manufacturing | 650 | 640 | 660 | 10 | -10 | -1.5% |
| Service-providing | 14,680 | 14,860 | 14,630 | -180 | 50 | 0.3% |
| - Wholesale trade | 530 | 530 | 540 | 0 | -10 | -1.9% |
| - Retail trade | 1,930 | 1,900 | 1,830 | 30 | 100 | 5.5% |
| - Transportation, warehousing, and utilities | 280 | 280 | 290 | 0 | -10 | -3.4% |
| - Information | 160 | 150 | 160 | 10 | 0 | 0.0% |
| - Financial activities | 380 | 380 | 390 | 0 | -10 | -2.6% |
| - Professional and business services | 890 | 880 | 850 | 10 | 40 | 4.7% |
| - Private education and health services | 1,740 | 1,730 | 1,720 | 10 | 20 | 1.2% |
| - Leisure and hospitality | 3,020 | 3,070 | 3,040 | -50 | -20 | -0.7% |
| - Other services | 430 | 430 | 440 | 0 | -10 | -2.3% |
| - Government | 5,330 | 5,500 | 5,390 | -170 | -60 | -1.1% |
Note: Data benchmarked through March 2025, updated September 15, 2025.
Source: Employment Security Department/Labor Market Information and Research Division, Washington employment estimates (WA-QB & CES)
Detailed tables can be found on the source page in the third spreadsheet titled Current employment estimates, not seasonally adjusted.
Industry employment (covered employment)
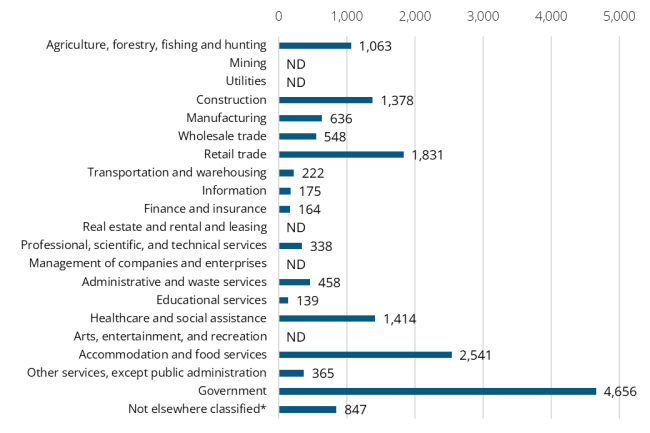
Employment by industry, Kittitas County 2024 annual average
Source: Employment Security Department/Labor Market Information and Research Division, Covered Employment (QCEW)
Covered employment, or Quarterly Census of Employment and Wage (QCEW) data, include agricultural and nonagricultural employment and wages for firms, organizations and individuals whose employees are covered by the Washington State Employment Security Act. The average annual covered employment during 2024 in Kittitas County was 16,775. The average annual wage was $54,172 which with total payroll of $908.74 million.
Top sectors in terms of employment in 2024:
-
Government (4,656 jobs or 27.8% employment share)
-
Accommodation and food services (2,541 jobs or 15.1% employment share)
-
Retail trade (1,831 jobs or 10.9% employment share)
-
Health care and social assistance (1,414 jobs or 8.4% employment share)
-
Construction (1,378 jobs or 8.2% employment share)
-
Agriculture (1,063 jobs or 6.3% employment share)
Top sectors in terms of average annual wages paid in 2024:
-
Finance and insurance ($75,298)
-
Construction ($73,235)
-
Government ($72,167)
-
Wholesale trade ($71,658)
-
Information ($71,326)
-
Professional, scientific and technical ($66,416)
Workforce demographics in Kittitas County
Kittitas County’s 16 and older population was 37,765 in 2023. The labor force participation rate in Kittitas County was 61.4% with an average unemployment rate of 5.1%.
Visit the U.S. Census Bureau website for more quick facts about Kittitas County.
Age
| Demographic characteristic | Total | Labor force participation rate | Unemployment rate |
|---|---|---|---|
| Population 16 years and over | 37,765 | 61.4% | 5.1% |
| 16 to 19 years | 3,452 | 50.6% | 23.6% |
| 20 to 24 years | 5,037 | 73.2% | 8.3% |
| 25 to 29 years | 3,041 | 88.0% | 5.4% |
| 30 to 34 years | 2,610 | 85.1% | 1.9% |
| 35 to 44 years | 4,899 | 78.3% | 2.4% |
| 45 to 54 years | 5,039 | 81.3% | 0.7% |
| 55 to 59 years | 2,510 | 74.1% | 3.2% |
| 60 to 64 years | 3,486 | 48.5% | 3.9% |
| 65 to 74 years | 4,768 | 26.4% | 2.4% |
| 75 years and over | 2,923 | 3.6% | 9.6% |
Race or Hispanic origin
| Demographic characteristic | Total | Labor force participation rate | Unemployment rate |
|---|---|---|---|
| White alone | 31,768 | 60.1% | 4.6% |
| Black or African American alone | 472 | 68.0% | 9.7% |
| American Indian and Alaska Native alone | 185 | 55.1% | 0.0% |
| Asian alone | 656 | 56.3% | 1.1% |
| Native Hawaiian and other Pacific Islander alone | 48 | 56.3% | 0.0% |
| Some other race alone | 1,946 | 72.9% | 3.8% |
| Two or more races | 2,690 | 68.4% | 12.3% |
| Hispanic or Latino origin (of any race) | 3,398 | 72.0% | 5.1% |
| White alone, not Hispanic or Latino | 30,812 | 60.2% | 4.5% |
| Population 20 to 64 years | 26,622 | 75.4% | 3.7% |
Sex
| Demographic characteristic | Total | Labor force participation rate | Unemployment rate |
|---|---|---|---|
| Male | 13,518 | 79.3% | 4.4% |
| Female | 13,104 | 71.3% | 2.8% |
Females with children
| Demographic characteristic | Total | Labor force participation rate | Unemployment rate |
|---|---|---|---|
| With own children under 18 | 3,954 | 68.8% | 0.7% |
| With own children under 6 only | 784 | 73.0% | 3.1% |
| With own children under 6 and 6 to 17 | 489 | 58.9% | 0.0% |
| With own children 6 to 17 only | 2,681 | 69.4% | 0.0% |
Poverty status in the past 12 months
| Demographic characteristic | Total | Labor force participation rate | Unemployment rate |
|---|---|---|---|
| Below poverty level | 3,953 | 44.5% | 11.8% |
| At or above the poverty level | 22,078 | 81.8% | 2.7% |
Disability status
| Demographic characteristic | Total | Labor force participation rate | Unemployment rate |
|---|---|---|---|
| With any disability | 3,047 | 46.6% | 10.8% |
Educational attainment
| Demographic characteristic | Total | Labor force participation rate | Unemployment rate |
|---|---|---|---|
| Population 25 to 64 years | 21,585 | 75.9% | 2.6% |
| Less than high school graduate | 1,654 | 57.4% | 5.3% |
| High school graduate (includes equivalency) | 5,804 | 74.0% | 2.7% |
| Some college or associate's degree | 6,167 | 70.6% | 2.0% |
| Bachelor's degree or higher | 7,960 | 85.2% | 2.6% |
Source: U.S. Census Bureau, American Community Survey 5-year estimates, S2301 | Employment Status
This workforce product was funded by a grant awarded by the U.S. Department of Labor's Employment and Training Administration. The product was created by the recipient and does not necessarily reflect the official position of the U.S. Department of Labor. The Department of Labor makes no guarantees, warranties, or assurances of any kind, expressed or implied, with respect to such information, including any information on linked sites and including, but not limited to, accuracy of the information or its completeness, timeliness, usefulness, adequacy, continued availability, or ownership. This product is copyrighted by the institution that created it. Internal use by an organization and/or personal use by an individual for non-commercial purposes is permissible. All other uses require the prior authorization of the copyright owner.