

Posted October 2025
August 2025 highlights
In August, the not seasonally adjusted monthly unemployment rate increased from 4.2% to 4.3%. Total nonfarm employment increased by 200 jobs in the Spokane-Spokane Valley MSA from August 2024.
Summary
Spokane County is in the northeast region of Washington state. About 555,947 people live in the county and the largest demographic is people 25-to-34-years of age. The City of Spokane is the second-largest city in Washington and serves as the business, transportation, medical, industrial, and cultural hub of the Inland Northwest.
Spokane County was created in 1858 and became a regional hub for mining, timber, and railroads in the 1870s. Historically, Spokane's economy has been shaped by its role as a regional service center for Eastern Washington and Northern Idaho. Major sectors are government, higher education, medical services, retail trade, and finance. Fairchild Air Force Base is the largest employer in the county.
The private sector has seen significant job increases over the past few years. Key industries with growth are transportation and warehousing, advanced manufacturing, health services, professional and business services, and finance and insurance.
Some recent developments include a health sciences campus, Amazon fulfillment centers, and biotechnology firms. Spokane is attracting investments from tourism, conventions, military, and research, supporting a diversified economy.
There were around 14,279 firms demanding labor in the county with 241,636 jobs filled by workers in 2023. Spokane County averaged about 262,245 people in the labor force in 2024, with a 4.5% unemployment rate. Spokane is part of the Spokane-Spokane Valley Metropolitan Statistical Area (MSA), which also includes Stevens County.
Spokane County geographic overview
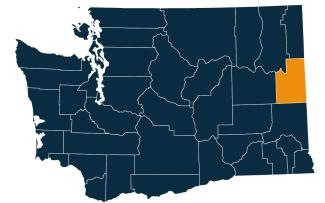
Spokane County is in eastern Washington and shares its eastern border with Idaho. Spokane is both the county seat and the largest city in Spokane County.
The county covers 1,764 square miles, including 17 square miles of water. Its landscape features a mix of urban areas, suburban developments, and beautiful natural settings, including rivers, lakes, and parks.
Spokane County was created out of Walla Walla County in 1858 and derives its name from the Spokane tribe.
Washington has 12 regional Workforce Development Areas. Spokane County is part of Area 12, the Spokane Workforce Development Area. Visit the Workforce Training & Education Coordinating Board website for information about the workforce regions.
Spokane County employment situation for August 2025
Monthly labor force and unemployment
- The not seasonally adjusted unemployment rate was 4.3% during August 2025, down from 4.7% in August 2024.
- The labor force decreased by 2,392 workers from August 2024 to August 2025.
- The total employed workers decreased by 1,298 workers from August 2024 to August 2025.
Unemployment rate, not seasonally adjusted
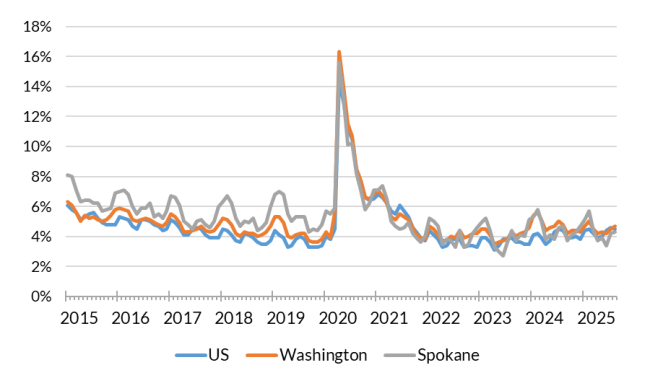
Source: Employment Security Department/Labor Market Information and Research Division, Local area unemployment statistics
Monthly nonfarm payroll employment in Spokane - Spokane Valley MSA
-
As of August 2025, total nonfarm employment in Spokane-Spokane Valley MSA was 266,000 jobs, a decrease of 1,400 jobs over the month but an increase of 200 jobs from August 2024.
- Private sectors, totaling 226,000 jobs, saw a decrease of 600 jobs over the month, but an increase of 400 jobs from August 2024 to August 2025.
- Goods producing sectors, with 34,000 jobs, remained unchanged over the month but decreased by 400 jobs from August 2024.
- Mining, logging and construction, with 16,600 jobs, increased by 100 jobs over the month, but decreased by 100 jobs from August 2024.
- Manufacturing, with 17,400 jobs, decreased by 100 jobs over the month and decreased by 300 jobs over the year.
- Service providing sectors, with 232,000 jobs, decreased by 1,400 jobs over the month but increased by 600 jobs from August 2024.
- Retail trade, with 27,500 jobs, remained unchanged over the month but decreased by 500 jobs from August 2024.
- The financial activities sector, with 13,900 jobs, remained unchanged over the month but decreased by 200 jobs from August 2024.
- Professional and business services, with 28,100 jobs, decreased by 200 jobs over the month and decreased by 2,300 jobs from August 2024.
- Private education and health services, with 60,900 jobs, decreased by 100 jobs over the month but increased by 3,700 jobs from August 2024.
- Leisure and hospitality, with 25,500 jobs, decreased by 200 jobs over the month and decreased by 500 jobs from August 2024.
- Government services, including public educational services totaling 40,000 jobs, decreased by 800 jobs over the month and decreased by 200 jobs from August 2024.
- The decrease over the month in the government sector can be attributed to local government education employment.
Nonfarm employment estimates, not seasonally adjusted, Spokane - Spokane Valley MSA
| NAICS Industry Title | Aug 2025 (Prelim) | Jul 2025 (Revised) | Aug 2024 (Revised) | Jul 2025 to Aug 2025 Change | Aug 2024 to Aug 2025 Change | Aug 2024 to Aug 2025 % Change |
|---|---|---|---|---|---|---|
| Total nonfarm | 266,000 | 267,400 | 265,800 | -1,400 | 200 | 0.1% |
| Total private (total nonfarm less government) | 226,000 | 226,600 | 225,600 | -600 | 400 | 0.2% |
| Goods-producing | 34,000 | 34,000 | 34,400 | 0 | -400 | -1.2% |
| - Mining, logging and construction | 16,600 | 16,500 | 16,700 | 100 | -100 | -0.6% |
| - Manufacturing | 17,400 | 17,500 | 17,700 | -100 | -300 | -1.7% |
| Service-providing | 232,000 | 233,400 | 231,400 | -1,400 | 600 | 0.3% |
| - Wholesale trade | 11,200 | 11,200 | 11,200 | 0 | 0 | 0.0% |
| - Retail trade | 27,500 | 27,500 | 28,000 | 0 | -500 | -1.8% |
| - Transportation, warehousing, and utilities | 12,300 | 12,300 | 11,400 | 0 | 900 | 7.9% |
| - Information | 2,700 | 2,700 | 3,000 | 0 | -300 | -10.0% |
| - Financial activities | 13,900 | 13,900 | 14,100 | 0 | -200 | -1.4% |
| - Professional and business services | 28,100 | 28,300 | 30,400 | -200 | -2,300 | -7.6% |
| - Private education and health services | 60,900 | 61,000 | 57,200 | -100 | 3,700 | 6.5% |
| - Leisure and hospitality | 25,500 | 25,700 | 26,000 | -200 | -500 | -1.9% |
| - Other services | 9,900 | 9,900 | 9,900 | 0 | 0 | 0.0% |
| - Government | 40,000 | 40,800 | 40,200 | -800 | -200 | -0.5% |
Note: Data benchmarked through March 2025, updated September 15, 2025.
Source: Employment Security Department/Labor Market Information and Research Division, Washington employment estimates (WA-QB & CES)
Detailed tables can be found on the source page in the third spreadsheet titled Current employment estimates, not seasonally adjusted.
Total covered employment
Employment by industry, Spokane County 2024 annual average
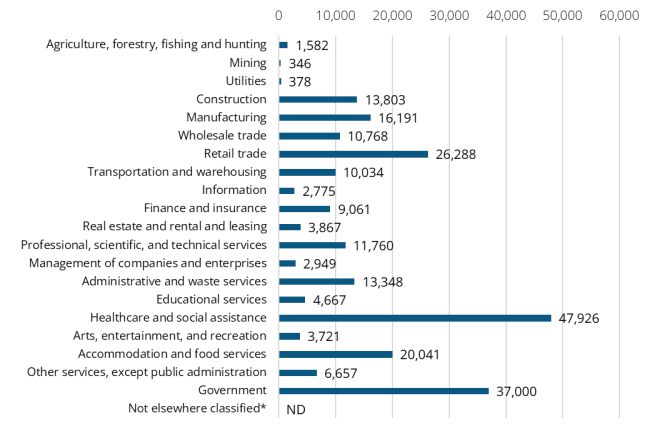
Source: Employment Security Department/Labor Market Information and Research Division, Covered Employment (QCEW)
The average annual covered employment in Spokane County was 243,161 in 2024. Covered employment refers to workers who received wages in Washington state and are eligible for state and federal unemployment insurance (UI) compensation programs.
Wages can vary substantially from one industry sector to another. The average annual wage in Washington state for all industries was $92,467 in 2024. The average annual wage in Spokane County was $65,458 in 2024.
Top sectors by employment in 2024:
- Health care and social assistance (47,926)
- Government (37,000)
- Retail trade (26,288)
- Accommodation and food services (20,041)
- Manufacturing (16,191)
Top sectors by average annual wages in 2024:
- Management of companies and enterprises ($129,862)
- Utilities ($109,706)
- Finance and insurance ($107,658)
- Mining ($107,485)
- Professional, scientific and technical services ($97,027)
Workforce demographics in Spokane County
The labor force participation rate is highest among the 25 to 29 years age group at 83.7%, while the 65 to 74 age group has the lowest at 22.7%. Participation rate for labor force prime working population 20 to 64 years of age was 76.7%.
Male workers have a slightly higher participation rate (80.7%) compared to female workers (72.7%). Those with a bachelor’s degree or higher have the highest participation rate at 85.6%, while people with less than a high school diploma have the lowest at 54.7%.
Visit the U.S. Census Bureau website for more quick facts about Spokane County.
Age
| Demographic characteristic | Total | Labor force participation rate | Unemployment rate |
|---|---|---|---|
| Population 16 years and over | 438,738 | 61.8% | 5.7% |
| 16 to 19 years | 26,511 | 42.3% | 18.2% |
| 20 to 24 years | 35,080 | 77.1% | 8.7% |
| 25 to 29 years | 39,888 | 83.7% | 7.4% |
| 30 to 34 years | 41,186 | 80.7% | 5.4% |
| 35 to 44 years | 72,388 | 81.3% | 5.0% |
| 45 to 54 years | 63,071 | 78.9% | 4.3% |
| 55 to 59 years | 31,083 | 71.7% | 3.1% |
| 60 to 64 years | 36,976 | 56.1% | 2.4% |
| 65 to 74 years | 56,730 | 22.7% | 4.4% |
| 75 years and over | 35,825 | 5.0% | 6.4% |
Race or Hispanic origin
| Demographic characteristic | Total | Labor force participation rate | Unemployment rate |
|---|---|---|---|
| White alone | 375,112 | 61.3% | 5.3% |
| Black or African American alone | 8,613 | 66.7% | 12.3% |
| American Indian and Alaska Native alone | 4,504 | 56.8% | 14.0% |
| Asian alone | 10,000 | 62.7% | 4.2% |
| Native Hawaiian and other Pacific Islander alone | 2,491 | 67.0% | 6.4% |
| Some other race alone | 8,653 | 71.4% | 6.6% |
| Two or more races | 29,365 | 64.6% | 8.3% |
| Hispanic or Latino origin (of any race) | 26,166 | 69.0% | 6.1% |
| White alone, not Hispanic or Latino | 367,058 | 61.1% | 5.3% |
| Population 20 to 64 years | 319,672 | 76.7% | 5.2% |
Sex
| Demographic characteristic | Total | Labor force participation rate | Unemployment rate |
|---|---|---|---|
| Male | 161,744 | 80.7% | 5.8% |
| Female | 157,928 | 72.7% | 4.6% |
Females with children
| Demographic characteristic | Total | Labor force participation rate | Unemployment rate |
|---|---|---|---|
| With own children under 18 | 52,115 | 74.2% | 5.0% |
| With own children under 6 only | 11,439 | 67.8% | 7.2% |
| With own children under 6 and 6 to 17 | 11,370 | 65.9% | 7.8% |
| With own children 6 to 17 only | 29,306 | 79.9% | 3.4% |
Poverty status in the past 12 months
| Demographic characteristic | Total | Labor force participation rate | Unemployment rate |
|---|---|---|---|
| Below poverty level | 39,291 | 43.6% | 26.2% |
| At or above the poverty level | 274,815 | 82.6% | 3.6% |
Disability status
| Demographic characteristic | Total | Labor force participation rate | Unemployment rate |
|---|---|---|---|
| With any disability | 43,472 | 44.3% | 11.1% |
Educational attainment
| Demographic characteristic | Total | Labor force participation rate | Unemployment rate |
|---|---|---|---|
| Population 25 to 64 years | 284,592 | 76.7% | 4.8% |
| Less than high school graduate | 15,934 | 54.7% | 11.9% |
| High school graduate (includes equivalency) | 68,014 | 71.8% | 5.9% |
| Some college or associate's degree | 109,627 | 75.5% | 5.4% |
| Bachelor's degree or higher | 91,017 | 85.6% | 2.7% |
Source: U.S. Census Bureau, American Community Survey 5-year estimates, S2301 | Employment Status
This workforce product was funded by a grant awarded by the U.S. Department of Labor's Employment and Training Administration. The product was created by the recipient and does not necessarily reflect the official position of the U.S. Department of Labor. The Department of Labor makes no guarantees, warranties, or assurances of any kind, expressed or implied, with respect to such information, including any information on linked sites and including, but not limited to, accuracy of the information or its completeness, timeliness, usefulness, adequacy, continued availability, or ownership. This product is copyrighted by the institution that created it. Internal use by an organization and/or personal use by an individual for non-commercial purposes is permissible. All other uses require the prior authorization of the copyright owner.