

- Posted October 2025
August 2025 highlights
Since July, the not seasonally adjusted unemployment rate increased to 4.3% from 4.1%, and total nonfarm employment was down 1,000 jobs.
Summary
The not seasonally adjusted unemployment rate was 4.3% in August 2025, up from 4.1% in July 2025 and down from 4.8% in August 2024. Kitsap County’s labor force had an estimated 121,005 workers in August 2025. There were approximately 364 initial claim filings for unemployment insurance coverage over the month. Total nonfarm employment, at 96,500 jobs, was 1,000 jobs lower over the month and was 100 jobs lower than last year.
Location
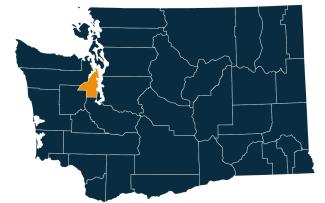
Kitsap County is the northern end of the Kitsap Peninsula, jutting into the Puget Sound between the Olympic Peninsula to the west and King County to the east. It is between Hood Canal and Admiralty Strait. Water transportation is dominant in the culture and economy. The county seat is Port Orchard.
Kitsap County is one of the smallest counties in the state in terms of land area at about 395 square miles. It ranks third, however, in the state in terms of its population density, with 750 people per square mile.
Kitsap County is synonymous with the Bremerton-Silverdale Metropolitan Statistical Area (MSA). Kitsap County is part of the Olympic Workforce Development Area. Visit the Workforce Training & Education Coordinating Board website for information about the 12 regions.
Employment situation for August 2025
Labor force and unemployment
- The not seasonally adjusted unemployment rate was 4.3% in August 2025, up from 4.1% in July 2025 and down from 4.8% in August 2024.
- The estimated labor force was 121,005 workers, up 876 workers compared to July but 150 workers below August 2024.
Unemployment rate, not seasonally adjusted
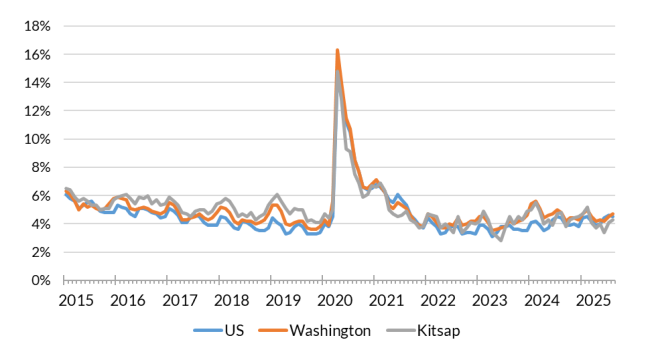
Source: Employment Security Department/Labor Market Information and Research Division, Local area unemployment statistics
Payroll employment
- Total nonfarm employment was estimated at 96,500 jobs in August 2025, 1,000 jobs lower than last month and 100 jobs lower than last year.
- Goods producing industry employment was unchanged over the month and over the year.
- Service providing industry jobs were down by 1,000 jobs over the month and down by 100 jobs over the year.
- Professional and business services industry jobs unchanged over the month and were 700 jobs below last year.
- Leisure and hospitality were 100 jobs below last month and 300 lower than last year.
- Government jobs were down 900 jobs over the month and were up by 200 over the year.
Nonfarm employment estimates, not seasonally adjusted, Kitsap County
| NAICS Industry Title | Aug 2025 (Prelim) | Jul 2025 (Revised) | Aug 2024 (Revised) | Jul 2025 to Aug 2025 Change | Aug 2024 to Aug 2025 Change | Aug 2024 to Aug 2025 % Change |
|---|---|---|---|---|---|---|
| Total nonfarm | 96,500 | 97,500 | 96,600 | -1,000 | -100 | -0.1% |
| Total private (total nonfarm less government) | 62,000 | 62,100 | 62,300 | -100 | -300 | -0.5% |
| Goods-producing | 7,500 | 7,500 | 7,500 | 0 | 0 | 0.0% |
| - Mining, logging and construction | 4,800 | 4,800 | 4,900 | 0 | -100 | -2.0% |
| - Manufacturing | 2,700 | 2,700 | 2,600 | 0 | 100 | 3.8% |
| Service-providing | 89,000 | 90,000 | 89,100 | -1,000 | -100 | -0.1% |
| - Trade, transportation, and utilities | 13,400 | 13,400 | 13,500 | 0 | -100 | -0.7% |
| - - Retail trade | 10,600 | 10,700 | 10,800 | -100 | -200 | -1.9% |
| - Professional and business services | 9,100 | 9,100 | 9,800 | 0 | -700 | -7.1% |
| - Leisure and hospitality | 9,800 | 9,900 | 10,100 | -100 | -300 | -3.0% |
| - Government | 34,500 | 35,400 | 34,300 | -900 | 200 | 0.6% |
Note: Data benchmarked through March 2025, updated September 15, 2025.
Source: Employment Security Department/Labor Market Information and Research Division, Washington employment estimates (WA-QB & CES)
Detailed tables can be found on the source page in the third spreadsheet titled Current employment estimates, not seasonally adjusted.
Industry employment (covered employment)
Employment by industry, Kitsap County 2024 annual average
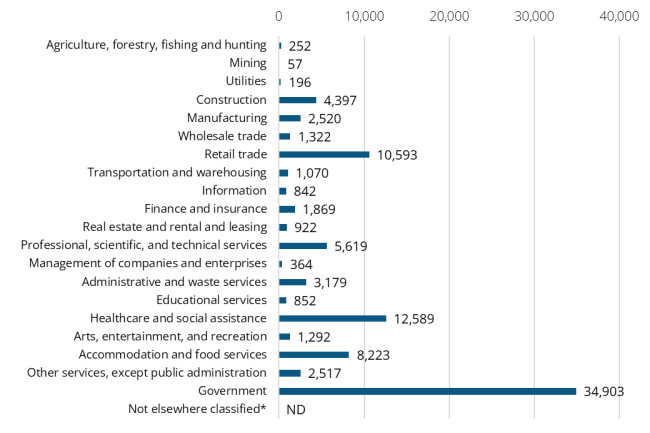
Source: Employment Security Department/Labor Market Information and Research Division, Covered Employment (QCEW)
Average annual covered employment in Kitsap County was 93,579 workers in 2024. Covered employment refers to state workers covered by state unemployment insurance (UI) laws and federal workers covered by the federal unemployment compensation program.
Top sectors in terms of employment in 2024:
- Government (34,903)
- Health care and social assistance (12,589)
- Retail trade (10,593)
- Accommodation and food services (8,223)
- Professional, scientific and technical services (5,619)
The average annual wage in Washington state for all industries was $92,467in 2024. The average annual wage in Kitsap County for all industries was $71,573 in 2024.
Top sectors in terms of average annual wages in 2024:
- Information ($146,394)
- Utilities ($123,380)
- Management of companies and enterprises ($103,371)
- Professional, scientific and technical services ($102,070)
- Finance and insurance ($96,885)
Workforce demographics in Kitsap County
Age
| Demographic characteristic | Total | Labor force participation rate | Unemployment rate |
|---|---|---|---|
| Population 16 years and over | 227,461 | 61.9% | 4.8% |
| 16 to 19 years | 11,552 | 44.0% | 18.9% |
| 20 to 24 years | 19,485 | 89.5% | 8.2% |
| 25 to 29 years | 19,980 | 82.9% | 5.0% |
| 30 to 34 years | 20,072 | 81.0% | 4.6% |
| 35 to 44 years | 36,023 | 83.1% | 3.9% |
| 45 to 54 years | 30,759 | 78.7% | 3.0% |
| 55 to 59 years | 18,392 | 72.2% | 3.4% |
| 60 to 64 years | 18,333 | 54.6% | 3.0% |
| 65 to 74 years | 32,537 | 20.7% | 5.9% |
| 75 years and over | 20,328 | 6.3% | 1.5% |
Race or Hispanic origin
| White alone | 178,473 | 60.4% | 4.6% |
|---|---|---|---|
| Black or African American alone | 5,853 | 70.9% | 1.9% |
| American Indian and Alaska Native alone | 2,276 | 63.8% | 4.4% |
| Asian alone | 11,795 | 61.7% | 4.0% |
| Native Hawaiian and other Pacific Islander alone | 1,976 | 57.7% | 4.5% |
| Some other race alone | 5,523 | 74.2% | 5.0% |
| Two or more races | 21,565 | 69.1% | 7.8% |
| Hispanic or Latino origin (of any race) | 17,894 | 71.6% | 5.7% |
| White alone, not Hispanic or Latino | 172,926 | 59.8% | 4.6% |
| Population 20 to 64 years | 163,044 | 78.3% | 4.2% |
Sex
| Demographic characteristic | Total | Labor force participation rate | Unemployment rate |
|---|---|---|---|
| Male | 86,143 | 86.2% | 4.2% |
| Female | 76,901 | 69.5% | 4.3% |
Females with children
| Demographic characteristic | Total | Labor force participation rate | Unemployment rate |
|---|---|---|---|
| With own children under 18 | 26,645 | 65.8% | 3.4% |
| With own children under 6 only | 7,524 | 59.8% | 3.6% |
| With own children under 6 and 6 to 17 | 4,940 | 56.8% | 5.1% |
| With own children 6 to 17 only | 14,181 | 72.2% | 2.8% |
Poverty status in the past 12 months
| Demographic characteristic | Total | Labor force participation rate | Unemployment rate |
|---|---|---|---|
| Below poverty level | 13,119 | 42.1% | 19.1% |
| At or above the poverty level | 145,050 | 81.2% | 3.5% |
Disability status
| Demographic characteristic | Total | Labor force participation rate | Unemployment rate |
|---|---|---|---|
| With any disability | 18,965 | 50.3% | 10.6% |
Educational attainment
| Demographic characteristic | Total | Labor force participation rate | Unemployment rate |
|---|---|---|---|
| Population 25 to 64 years | 143,559 | 76.8% | 3.8% |
| Less than high school graduate | 6,862 | 56.5% | 8.4% |
| High school graduate (includes equivalency) | 31,765 | 71.0% | 6.5% |
| Some college or associate's degree | 54,335 | 76.9% | 3.0% |
| Bachelor's degree or higher | 50,597 | 83.0% | 2.7% |
Source: U.S. Census Bureau, American Community Survey 5-year estimates, S2301 | Employment Status
This workforce product was funded by a grant awarded by the U.S. Department of Labor's Employment and Training Administration. The product was created by the recipient and does not necessarily reflect the official position of the U.S. Department of Labor. The Department of Labor makes no guarantees, warranties, or assurances of any kind, expressed or implied, with respect to such information, including any information on linked sites and including, but not limited to, accuracy of the information or its completeness, timeliness, usefulness, adequacy, continued availability, or ownership. This product is copyrighted by the institution that created it. Internal use by an organization and/or personal use by an individual for non-commercial purposes is permissible. All other uses require the prior authorization of the copyright owner.