

Posted October 2025
August 2025 highlights
The unemployment rate in the county was 4.4% in August 2025, which increased from 4.3% in July 2025 and recorded an increase from 4.3% in August 2024. Overall job trends show Skamania County experienced a decline in employment, losing 30 jobs, a 1.3% decrease compared to August 2024, with total payroll employment at 2,310.
Summary
Skamania County continued to experience notable economic shifts through 2024 and into 2025, building on its long-term transition from a timber-reliant economy to one increasingly centered on tourism, recreation and small-scale services. According to the latest QCEW data, average annual employment in 2024 was approximately 2,197, reflecting a slight decline from 2023. Total payroll reached $121.42 million, an average annual wage of $55,267.
The tourism sector remains a vital component of Skamania County’s economy. While the initial impact of the COVID-19 pandemic led to sharp employment losses, the years following, especially 2021 through 2023, saw gradual recovery. However, 2024 marked a 3.4% decline in total nonfarm employment, indicating renewed challenges in service-based sectors.
As of August 2025, the unemployment rate stood at 4.4%, an increase from 4.3% in July 2025 and reflecting a stable labor market. The labor force numbered 5,949, with 261 individuals actively seeking work, down 0.3% from the previous year. This trend aligns with broader state and national patterns of gradual labor market tightening.
Major infrastructure and development projects continue to shape the county’s economic landscape. These include the Goldendale Energy Storage Project, the Port of Skamania’s Cascades Business Park and Skamania PUD’s water system upgrades — all aimed at enhancing regional connectivity, utility resilience and long-term job creation.
Skamania County geographic overview
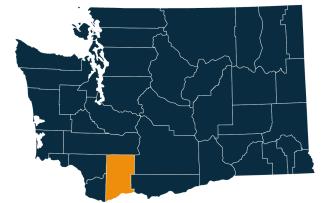
Skamania County is in the southwestern part of Washington. It is part of the Portland-Vancouver-Hillsboro metropolitan area. The town of Stevenson is the county seat. Carson is the largest community in the county. Skamania County’s population was 12,036 in the 2020 census. In 2022, the Census estimated the population at 12,460, which is 3.5% growth from the 2020 census.
The county covers 1,683 square miles, including 28 square miles of water. It features a mix of forested areas and rugged terrain marked by rivers and mountains.
Skamania County was created out of Clark County in 1854 and derives its name from a Chinook word meaning swift waters.
Washington has 12 regional Workforce Development Areas. Skamania County is part of Area 9, South Central Workforce Development Area. Visit the Workforce Training & Education Coordinating Board website for information about the workforce regions.
Skamania County employment situation for August 2025
Monthly labor force and unemployment
-
As of August 2025, Skamania County’s total labor force, employment and unemployment increased since August 2024.
-
Skamania County has more than 5,949 people in the labor force, with an increase of 0.3% or 17 workers from August 2024, while the employed workforce increased by 0.2% or 11 workers and unemployed workers increased by 2.4% or 6 workers. About 261 people were unemployed and looking for work.
-
The unemployment rate in the county was 4.4% in August 2025, which increased from 4.3% in July 2025 and recorded an increase from 4.3% in August 2024.
Unemployment rate, not seasonally adjusted
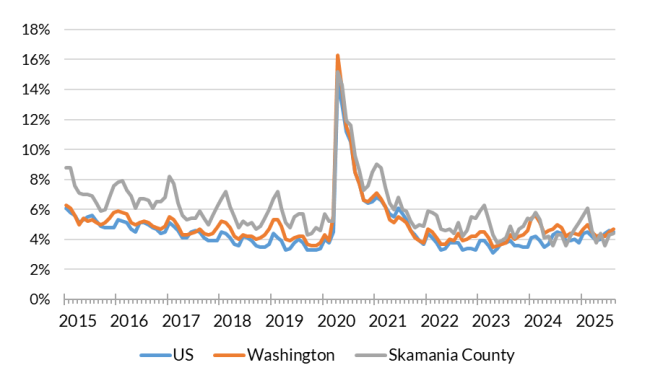
Source: Employment Security Department/Labor Market Information and Research Division, Local area unemployment statistics
Monthly payroll employment in Skamania County
-
Overall job trends show that Skamania County experienced a decline in employment, losing 30 jobs, a 1.3% decrease compared to August 2024, with total payroll employment at 2,310. The private sector contracted by 30 jobs, a 1.8% decrease, while government employment increased by 1.5% or 10 jobs since August 2024.
-
Industries with growth include professional and business services with 10 jobs, or 9.1%, and private education and health services increased by 10 jobs, or 11.1%, year-over-year.
-
Industries facing declines include leisure and hospitality, which fell by 7.5%. All the other industries remained unchanged.
-
Government employment increased by 1.5%, losing 10 jobs, though federal and state government positions remained unchanged. Local government employment increased by 1.9%, up by 10 jobs.
Nonfarm employment estimates, not seasonally adjusted, Skamania County
| NAICS Industry Title | Aug 2025 (Prelim) | Jul 2025 (Revised) | Aug 2024 (Revised) | Jul 2025 to Aug 2025 Change | Aug 2024 to Aug 2025 Change | Aug 2024 to Aug 2025 % Change |
|---|---|---|---|---|---|---|
| Total nonfarm | 2,310 | 2,290 | 2,340 | 20 | -30 | -1.3% |
| Total private (total nonfarm less government) | 1,640 | 1,620 | 1,670 | 20 | -30 | -1.8% |
| Goods-producing | 420 | 410 | 410 | 10 | 10 | 2.4% |
| - Mining and logging | 20 | 20 | 20 | 0 | 0 | 0.0% |
| - Construction | 60 | 60 | 60 | 0 | 0 | 0.0% |
| - Manufacturing | 340 | 330 | 340 | 10 | 0 | 0.0% |
| Service-providing | 1,890 | 1,880 | 1,920 | 10 | -30 | -1.6% |
| - Wholesale trade | 40 | 40 | 40 | 0 | 0 | 0.0% |
| - Retail trade | 190 | 190 | 190 | 0 | 0 | 0.0% |
| - Transportation, warehousing, and utilities | 40 | 40 | 40 | 0 | 0 | 0.0% |
| - Information | 10 | 10 | 10 | 0 | 0 | 0.0% |
| - Financial activities | 50 | 50 | 50 | 0 | 0 | 0.0% |
| - Professional and business services | 120 | 120 | 110 | 0 | 10 | 9.1% |
| - Private education and health services | 100 | 100 | 90 | 0 | 10 | 11.1% |
| - Leisure and hospitality | 620 | 620 | 670 | 0 | -50 | -7.5% |
| - Other services | 60 | 60 | 60 | 0 | 0 | 0.0% |
| - Government | 670 | 660 | 660 | 10 | 10 | 1.5% |
Note: Data benchmarked through March 2025, updated September 15, 2025.
Source: Employment Security Department/Labor Market Information and Research Division, Washington employment estimates (WA-QB & CES)
Detailed tables can be found on the source page in the third spreadsheet titled Current employment estimates, not seasonally adjusted.
Total covered employment in Skamania County
In 2024, Skamania County wages totaled more than $121.42 million with an average annual wage of $55,267. Average annual covered employment was 2,197. Covered employment refers to workers who received wages in Washington state and are eligible for state and federal unemployment insurance (UI) compensation programs.
The construction sector employed 62 individuals with an average wage of $79,465. Manufacturing had 314 employees earning an average of $42,132. Information industry had the highest average annual wage of $176,991, followed by professional services average annual wage of $159,147. Government and accommodation and food services had the highest employment levels.
The accommodation and food services sector was a major employer, with 563 employees earning an average of $36,161. Government employment was substantial, with 629 employees and an average wage of $64,787.
Overall, Skamania County’s employment trends reflect a diverse economy with strong contributions from construction, manufacturing and government sectors, alongside high-wage professional services.
Employment by industry, Skamania County 2024 annual average
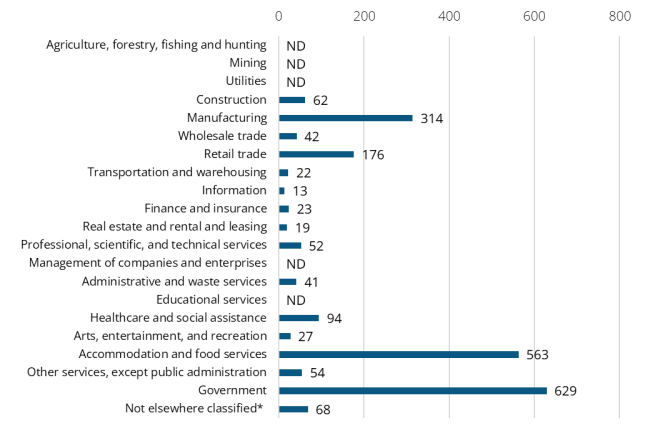
Source: Employment Security Department/Labor Market Information and Research Division, Covered Employment (QCEW)
Top sectors in terms of employment in 2024:
-
Government (629 jobs or 28.6% employment share)
-
Accommodation and food services (563 jobs or 25.6% employment share)
-
Manufacturing (314 jobs or 14.3% employment share)
-
Retail trade (176 jobs or 8.0% employment share)
-
Health care and social assistance (94 jobs or 4.3% employment share)
-
Construction (62 jobs or 2.8% employment share)
Wages can vary substantially from one industry sector to another. The 2024 average annual wage in Skamania County for all industries was $55,267. Total payroll was $121.42 million.
Top sectors in terms of wages in 2024:
-
Information ($176,991)
-
Professional, scientific and technical services ($159,147)
-
Wholesale trade ($119,040)
-
Finance and insurance ($91,891)
-
Construction ($79,465)
-
Administrative and waste services ($76,979)
-
Government ($64,787)
Workforce demographics in Skamania County
The labor force participation rate is highest among the 30 to 34 years age group at 90.3%, while the 65 to 74 age group has the lowest at 26.5%. Participation rate for prime working population 20 to 64 years of age was 75.1%.
Male workers have a slightly higher participation rate (81.0%) compared to female workers (69.1%). People with a bachelor’s degree or higher have the highest participation rate at 81.6%, while those with less than a high school diploma have the lowest at 52.8%.
Visit the U.S. Census Bureau website for quick facts about Skamania County.
Age
| Demographic characteristic | Total | Labor force participation rate | Unemployment rate |
|---|---|---|---|
| Population 16 years and over | 10,439 | 58.4% | 5.7% |
| 16 to 19 years | 515 | 57.1% | 16.0% |
| 20 to 24 years | 476 | 88.4% | 23.0% |
| 25 to 29 years | 547 | 83.0% | 8.1% |
| 30 to 34 years | 701 | 90.3% | 0.3% |
| 35 to 44 years | 1,459 | 79.6% | 4.9% |
| 45 to 54 years | 1,713 | 86.2% | 3.8% |
| 55 to 59 years | 922 | 63.1% | 8.6% |
| 60 to 64 years | 1,234 | 46.3% | 0.0% |
| 65 to 74 years | 1,825 | 26.5% | 0.4% |
| 75 years and over | 1,047 | 1.8% | 0.0% |
Race or Hispanic origin
| Demographic characteristic | Total | Labor force participation rate | Unemployment rate |
|---|---|---|---|
| White alone | 9,150 | 57.3% | 5.1% |
| Black or African American alone | 34 | 38.2% | 0.0% |
| American Indian and Alaska Native alone | 146 | 52.1% | 2.6% |
| Asian alone | 142 | 81.7% | 7.8% |
| Native Hawaiian and other Pacific Islander alone | 20 | 55.0% | 0.0% |
| Some other race alone | 332 | 81.6% | 2.2% |
| Two or more races | 615 | 60.0% | 16.8% |
| Hispanic or Latino origin (of any race) | 613 | 84.0% | 7.8% |
| White alone, not Hispanic or Latino | 8,842 | 56.4% | 5.1% |
| Population 20 to 64 years | 7,052 | 75.1% | 5.6% |
Sex
| Demographic characteristic | Total | Labor force participation rate | Unemployment rate |
|---|---|---|---|
| Male | 3,574 | 81.0% | 7.8% |
| Female | 3,478 | 69.1% | 3.1% |
Females with children
| Demographic characteristic | Total | Labor force participation rate | Unemployment rate |
|---|---|---|---|
| With own children under 18 | 872 | 74.9% | 4.0% |
| With own children under 6 only | 181 | 84.5% | 0.0% |
| With own children under 6 and 6 to 17 | 177 | 62.1% | 7.3% |
| With own children 6 to 17 only | 514 | 75.9% | 4.6% |
Poverty status in the past 12 months
| Demographic characteristic | Total | Labor force participation rate | Unemployment rate |
|---|---|---|---|
| Below poverty level | 640 | 38.6% | 19.4% |
| At or above the poverty level | 6,370 | 79.3% | 5.0% |
Disability status
| Demographic characteristic | Total | Labor force participation rate | Unemployment rate |
|---|---|---|---|
| With any disability | 726 | 41.5% | 1.0% |
Educational attainment
| Demographic characteristic | Total | Labor force participation rate | Unemployment rate |
|---|---|---|---|
| Population 25 to 64 years | 6,576 | 74.2% | 4.1% |
| Less than high school graduate | 468 | 52.8% | 8.9% |
| High school graduate (includes equivalency) | 1,702 | 78.2% | 4.4% |
| Some college or associate's degree | 2,427 | 69.5% | 3.4% |
| Bachelor's degree or higher | 1,979 | 81.6% | 4.0% |
Source: U.S. Census Bureau, American Community Survey 5-year estimates, S2301 | Employment Status
This workforce product was funded by a grant awarded by the U.S. Department of Labor's Employment and Training Administration. The product was created by the recipient and does not necessarily reflect the official position of the U.S. Department of Labor. The Department of Labor makes no guarantees, warranties, or assurances of any kind, expressed or implied, with respect to such information, including any information on linked sites and including, but not limited to, accuracy of the information or its completeness, timeliness, usefulness, adequacy, continued availability, or ownership. This product is copyrighted by the institution that created it. Internal use by an organization and/or personal use by an individual for non-commercial purposes is permissible. All other uses require the prior authorization of the copyright owner.