

Posted October 2025
August 2025 highlights
In August, the not seasonally adjusted monthly unemployment rate remained unchanged at 6.6%. Total nonfarm employment decreased by 10 jobs in Ferry County from August 2024 to August 2025.
Summary
With a population of 7,497 people, Ferry County has one of the state’s smallest labor markets. The largest demographic is people aged 65 to 74 years with 20.0% of total population share. There are around 249 firms in the county. About half of the 1,750 jobs in the labor market are private and half are government jobs. In the sparsely populated and very rugged mountainous regions of Ferry County, unemployment is typically higher than most other counties in the state. Many of the county’s jobs are in mining and logging. There are 2,361 workers in the labor market. Ferry County currently has the second-highest unemployment rate in the state at 6.6% in August 2025.
Ferry County geographic overview
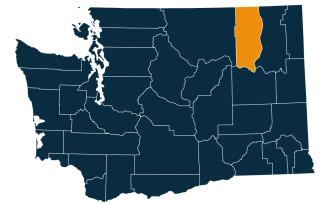
Ferry County is located in the northeastern part of Washington. It is known for its rugged natural beauty and outdoor recreational opportunities. Republic serves as the county seat and is the largest city in Ferry County.
The county spans 2,257 square miles, including 24 square miles of water. Its landscape features forests, mountains, and several lakes and rivers.
Ferry County was created out of Stevens County in 1899 and is named after Elisha P. Ferry, the first governor of Washington.
Washington has 12 regional Workforce Development Areas. Ferry County is part of Area 10, the Eastern Washington Partnership. Visit the Workforce Training & Education Coordinating Board website for information about the workforce regions.
Ferry County employment situation for August 2025
Monthly labor force and unemployment
- The not seasonally adjusted unemployment rate was 6.6% during August 2025, down from 7.2% in August 2024.
- The August 2025 labor force of 2,361 workers decreased by 15 from August 2024.
- The total number of employed workers was 2,204, a decrease of one worker from August 2024 to August 2025.
Unemployment rate, not seasonally adjusted
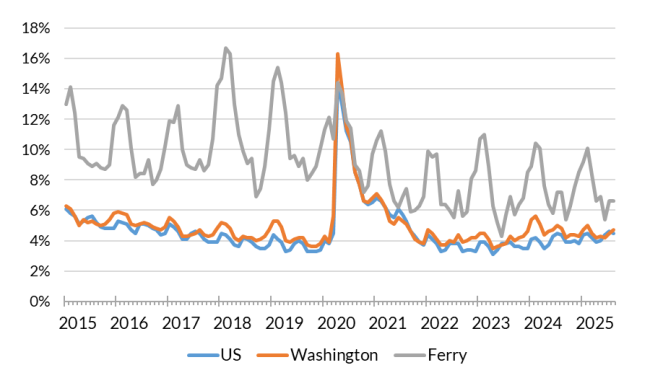
Source: Employment Security Department/Labor Market Information and Research Division, Local area unemployment statistics
Monthly nonfarm payroll employment in Ferry County
- As of August 2025, total nonfarm employment in Ferry County was 1,750 jobs. Total nonfarm employment was unchanged month to month but decreased by 10 jobs over the past year.
- Total private sector employment accounts for 850 jobs in Ferry County, which was unchanged from July 2025 to August 2025, and is down 30 jobs from August 2024.
- Goods producing sectors were unchanged month to month but decreased by 20 jobs from August 2024.
- The construction industry accounts for 90 jobs in the county, which decreased by 10 jobs from August 2024.
- Manufacturing, with 100 jobs, was unchanged month to month but decreased by 10 jobs over the year.
- Service providing sectors, with 1,540 jobs, was unchanged month to month, but increased by 10 jobs from August 2024 to August 2025.
- Government, with a total of 900 jobs, remained unchanged in the past month but recorded an increase of 20 jobs in the past year. Local government accounts for all the job growth in the government sector for the past year.
Nonfarm employment estimates, not seasonally adjusted, Ferry County
| NAICS Industry Title | Aug 2025 (Prelim) | Jul 2025 (Revised) | Aug 2024 (Revised) | Jul 2025 to Aug 2025 Change | Aug 2024 to Aug 2025 Change | Aug 2024 to Aug 2025 % Change |
|---|---|---|---|---|---|---|
| Total nonfarm | 1,750 | 1,750 | 1,760 | 0 | -10 | -0.6% |
| Total private (total nonfarm less government) | 850 | 850 | 880 | 0 | -30 | -3.4% |
| Goods-producing | 210 | 210 | 230 | 0 | -20 | -8.7% |
| - Mining and logging | 20 | 20 | 20 | 0 | 0 | 0.0% |
| - Construction | 90 | 90 | 100 | 0 | -10 | -10.0% |
| - Manufacturing | 100 | 100 | 110 | 0 | -10 | -9.1% |
| Service-providing | 1,540 | 1,540 | 1,530 | 0 | 10 | 0.7% |
| - Wholesale trade | 10 | 10 | 10 | 0 | 0 | 0.0% |
| - Retail trade | 160 | 160 | 150 | 0 | 10 | 6.7% |
| - Transportation, warehousing, and utilities | 10 | 10 | 10 | 0 | 0 | 0.0% |
| - Information | 20 | 20 | 30 | 0 | -10 | -33.3% |
| - Financial activities | 30 | 30 | 30 | 0 | 0 | 0.0% |
| - Professional and business services | 70 | 70 | 70 | 0 | 0 | 0.0% |
| - Private education and health services | 100 | 100 | 110 | 0 | -10 | -9.1% |
| - Leisure and hospitality | 190 | 190 | 190 | 0 | 0 | 0.0% |
| - Other services | 40 | 40 | 40 | 0 | 0 | 0.0% |
| - Government | 900 | 900 | 880 | 0 | 20 | 2.3% |
Note: Data benchmarked through March 2025, updated September 15, 2025.
Source: Employment Security Department/Labor Market Information and Research Division, Washington employment estimates (WA-QB & CES)
Detailed tables can be found on the source page in the third spreadsheet titled Current employment estimates, not seasonally adjusted.
Total covered employment
Employment by industry, Ferry County 2024 annual average
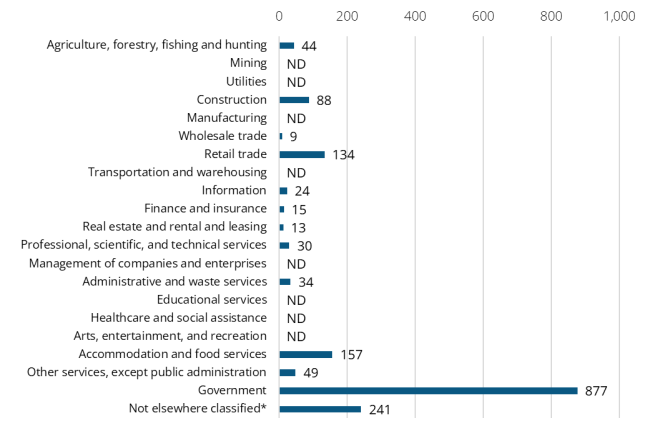
Source: Employment Security Department/Labor Market Information and Research Division, Covered Employment (QCEW)
The average annual covered employment in Ferry County was 1,713 during 2024. Covered employment refers to workers who received wages in Washington state and are eligible for state and federal unemployment insurance (UI) compensation programs.
Wages can vary substantially from one industry sector to another. The average annual wage in Washington state for all industries was $92,467 in 2024. The average annual wage in Ferry County was $52,740 in 2024.
Top five sectors in terms of employment during 2024:
- Government (877)
- Other (241)
- Accommodation and food services (157)
- Retail trade (134)
- Construction (88)
Top five sectors by average annual wage during 2024:
- Government ($62,622)
- Professional, scientific and technical services ($62,109)
- Other ($59,761)
- Wholesale trade ($58,783)
- Agriculture, forestry, fishing and hunting ($50,803)
Workforce demographics is Ferry County
The labor force participation rate is highest among the 25-29 age group at 74.3%, while the 65-74 age group has the lowest at 22.5%.
Male workers have a slightly higher participation rate (62.5%) compared to female workers (59.8%). Those with a bachelor’s degree or higher have the highest participation rate at 78.1%, while those with a high school diploma have the lowest at 61.4%.
Visit the U.S. Census Bureau website for mor quick facts about Ferry County.
Age
| Demographic characteristic | Total | Labor force participation rate | Unemployment rate |
|---|---|---|---|
| Population 16 years and over | 6,204 | 44.4% | 10.1% |
| 16 to 19 years | 236 | 36.0% | 38.8% |
| 20 to 24 years | 305 | 58.7% | 27.9% |
| 25 to 29 years | 261 | 74.3% | 2.6% |
| 30 to 34 years | 281 | 46.3% | 6.2% |
| 35 to 44 years | 769 | 72.7% | 7.3% |
| 45 to 54 years | 861 | 69.8% | 4.5% |
| 55 to 59 years | 565 | 57.5% | 11.7% |
| 60 to 64 years | 717 | 43.4% | 5.1% |
| 65 to 74 years | 1,465 | 22.5% | 13.3% |
| 75 years and over | 744 | 5.4% | 37.5% |
Race or Hispanic origin
| Demographic characteristic | Total | Labor force participation rate | Unemployment rate |
|---|---|---|---|
| White alone | 4,751 | 40.8% | 8.0% |
| Black or African American alone | 12 | 41.7% | 0.0% |
| American Indian and Alaska Native alone | 757 | 58.9% | 12.3% |
| Asian alone | 19 | 15.8% | 0.0% |
| Native Hawaiian and other Pacific Islander alone | 123 | 59.3% | 50.7% |
| Some other race alone | 49 | 87.8% | 37.2% |
| Two or more races | 493 | 50.1% | 6.1% |
| Hispanic or Latino origin (of any race) | 179 | 49.2% | 59.1% |
| White alone, not Hispanic or Latino | 4,669 | 40.3% | 6.2% |
| Population 20 to 64 years | 3,759 | 61.2% | 8.0% |
Sex
| Demographic characteristic | Total | Labor force participation rate | Unemployment rate |
|---|---|---|---|
| Male | 1,847 | 62.5% | 8.5% |
| Female | 1,912 | 59.8% | 7.6% |
Females with children
| Demographic characteristic | Total | Labor force participation rate | Unemployment rate |
|---|---|---|---|
| With own children under 18 | 349 | 61.6% | 10.7% |
| With own children under 6 only | 95 | 52.6% | 36.0% |
| With own children under 6 and 6 to 17 | 66 | 71.2% | 10.6% |
| With own children 6 to 17 only | 188 | 62.8% | 0.0% |
Poverty status in the past 12 months
| Demographic characteristic | Total | Labor force participation rate | Unemployment rate |
|---|---|---|---|
| Below poverty level | 568 | 28.5% | 25.3% |
| At or above the poverty level | 3,147 | 67.9% | 6.7% |
Disability status
| Demographic characteristic | Total | Labor force participation rate | Unemployment rate |
|---|---|---|---|
| With any disability | 827 | 35.6% | 23.1% |
Educational attainment
| Demographic characteristic | Total | Labor force participation rate | Unemployment rate |
|---|---|---|---|
| Population 25 to 64 years | 3,454 | 61.4% | 6.4% |
| Less than high school graduate | 259 | 38.2% | 5.1% |
| High school graduate (includes equivalency) | 1,158 | 61.7% | 12.0% |
| Some college or associate's degree | 1,453 | 58.6% | 4.5% |
| Bachelor's degree or higher | 584 | 78.1% | 1.3% |
Source: U.S. Census Bureau, American Community Survey 5-year estimates, S2301 | Employment Status
This workforce product was funded by a grant awarded by the U.S. Department of Labor's Employment and Training Administration. The product was created by the recipient and does not necessarily reflect the official position of the U.S. Department of Labor. The Department of Labor makes no guarantees, warranties, or assurances of any kind, expressed or implied, with respect to such information, including any information on linked sites and including, but not limited to, accuracy of the information or its completeness, timeliness, usefulness, adequacy, continued availability, or ownership. This product is copyrighted by the institution that created it. Internal use by an organization and/or personal use by an individual for non-commercial purposes is permissible. All other uses require the prior authorization of the copyright owner.