

Posted October 2025
August 2025 highlights
The unemployment rate in the county was 4.2% in August 2025, which increased from 3.8% in July 2025, and the unemployment rate decreased from 3.9% in August 2024. Overall job trends show the Kennewick-Pasco-Richland Metro area had total nonfarm employment of 128,500 jobs in August 2025, representing a 0.5% decrease with 700 jobs decreased from August 2024.
Summary
Columbia County’s economy has continued to demonstrate resilience and modest growth through 2024 and into 2025, supported by strong performance in health care, education, and retail. These sectors have remained central to economic stability and employment.
Columbia County’s resident workforce has experienced ongoing changes from year to year. From 2016 to 2019, the county saw strong labor force growth and declining unemployment. The pandemic led to decreases in both labor force and employment, along with a rise in unemployment. After 2021, the resident workforce rebounded and grew. However, in 2024 and into 2025, the county’s workforce numbers stabilized, with modest declines in labor force and employment, while the unemployment rate remained steady. As of August 2025, the county’s unemployment rate stood at 4.2%.
This marks a significant improvement in labor market conditions and signals a more competitive job environment.
The health care sector has expanded further due to sustained demand and the addition of new facilities, contributing to job creation and boosting local business revenues. Columbia County has also advanced several community development initiatives aimed at improving infrastructure and digital connectivity. These efforts are expected to generate additional employment opportunities and support long-term economic expansion.
Together, these developments underscore Columbia County’s commitment to fostering a dynamic and inclusive economy, with a growing emphasis on workforce development and small business support.
Columbia County geographic overview
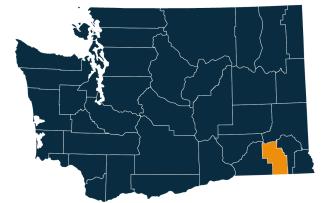
Columbia County is in the southeastern part of Washington. It is part of the Walla Walla metropolitan area. The town of Dayton is the county seat and also the largest city in the county. Columbia County’s population was 3,952 in the 2020 census. In 2022, the Census estimated the population at 4,026, which is 1.9% growth from the 2020 census.
The county covers 873 square miles, including 4.9 square miles of water. It features a mix of agricultural land and rolling prairie-like terrain.
Columbia County was created out of Walla Walla County in 1875 and was named after the Columbia River.
Washington has 12 regional Workforce Development Areas. Columbia County is part of Area 10, the Eastern Washington Partnership. Visit the Workforce Training & Education Coordinating Board website for information about the workforce regions.
Columbia County employment situation for August 2025
Monthly labor force and unemployment
-
As of August 2025, Columbia County total labor force and employment decreased, while unemployment increased since August 2024.
-
Columbia County has over 1,942 people in the labor force, with a decrease of 1.7% or 34 workers from August 2024, while the employed workforce decreased by 2.1% or 39 workers and unemployed workers increased by 6.5% or 5 workers. About 82 people were unemployed and looking for work.
-
The unemployment rate in the county was 4.2% in August 2025, which increased from 3.8% in July 2025 and increased from 3.9% in August 2024.
Unemployment rate, not seasonally adjusted
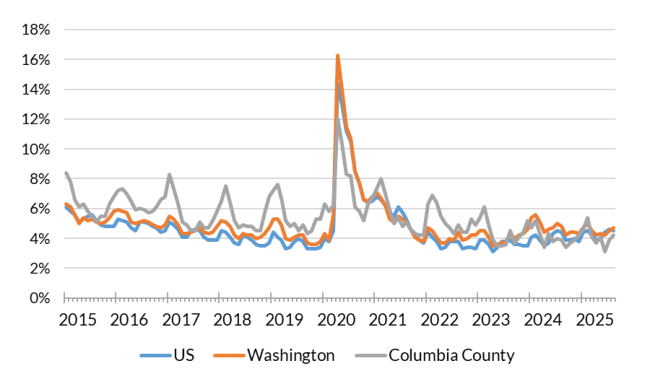
Source: Employment Security Department/Labor Market Information and Research Division, Local area unemployment statistics
Monthly nonfarm payroll employment in Columbia County
-
Overall job trends show that Columbia County had total nonfarm employment of 1,410 jobs, reflecting a 1.4% increase, with 20 jobs added compared to August 2024. The private sector increased by 10 jobs or 1.4% year-over-year, while government employment increased by 1.5%, adding 10 jobs.
-
Industries with growth include transportation, warehousing, and utilities with 10 jobs or 5.3% increase and leisure and hospitality, which added 10 jobs (9.1%) year-over-year.
-
Industries facing declines include retail trade, which declined by 9.1%, shedding 10 jobs. Other industries remained unchanged.
-
Government employment trends reflect continued shifts with a slight increase of 10 jobs or 1.5% year-over-year, with state and federal positions holding steady, while local government increased by 3.8%, adding 20 positions.
Nonfarm employment estimates, not seasonally adjusted, Columbia County
| NAICS Industry Title | Aug 2025 (Prelim) | Jul 2025 (Revised) | Aug 2024 (Revised) | Jul 2025 to Aug 2025 Change | Aug 2024 to Aug 2025 Change | Aug 2024 to Aug 2025 % Change |
|---|---|---|---|---|---|---|
| Total nonfarm | 1,410 | 1,410 | 1,390 | 0 | 20 | 1.4% |
| Total private (total nonfarm less government) | 750 | 750 | 740 | 0 | 10 | 1.4% |
| Goods-producing | 170 | 170 | 170 | 0 | 0 | 0.0% |
| - Mining, Logging and Construction | 130 | 130 | 130 | 0 | 0 | 0.0% |
| - Construction | 130 | 130 | 130 | 0 | 0 | 0.0% |
| - Manufacturing | 40 | 40 | 40 | 0 | 0 | 0.0% |
| Service-providing | 1,240 | 1,240 | 1,220 | 0 | 20 | 1.6% |
| - Wholesale trade | 10 | 10 | 10 | 0 | 0 | 0.0% |
| - Retail trade | 100 | 90 | 110 | 10 | -10 | -9.1% |
| - Transportation, warehousing, and utilities | 200 | 200 | 190 | 0 | 10 | 5.3% |
| - Information | 10 | 10 | 10 | 0 | 0 | 0.0% |
| - Financial activities | 20 | 20 | 20 | 0 | 0 | 0.0% |
| - Professional and business services | 30 | 30 | 30 | 0 | 0 | 0.0% |
| - Private education and health services | 60 | 60 | 60 | 0 | 0 | 0.0% |
| - Leisure and hospitality | 120 | 120 | 110 | 0 | 10 | 9.1% |
| - Other services | 30 | 30 | 30 | 0 | 0 | 0.0% |
| - Government | 660 | 660 | 650 | 0 | 10 | 1.5% |
Note: Data benchmarked through March 2025, updated September 15, 2025.
Source: Employment Security Department/Labor Market Information and Research Division, Washington employment estimates (WA-QB & CES)
Detailed tables can be found on the source page in the third spreadsheet titled Current employment estimates, not seasonally adjusted.
Total covered employment in Columbia County
In 2024, Columbia County had a total of 1,503 total covered jobs with a small decline of 62 jobs over-the-year, with $371.7 million in total payroll wages and average annual wage of $54,469. Covered employment refers to workers who received wages in Washington state and are eligible for state and federal unemployment insurance (UI) compensation programs.
There are few major industries. The government sector remained the largest employer, accounting for 40.6% of total employment, with average annual wage at $64,603. This sector saw a modest increase (25 jobs or 4.3%) in jobs, reflecting the stability and importance of public services in the county. Agriculture continued to be a significant part of the local economy at 8.4% of total employment. The sector includes crop production, livestock, and related activities.
The construction and retail trade industries experienced growth driven by an increasing demand. Retail trade supported local needs and tourism and saw steady employment.
The renewable energy industry, including wind and solar power projects, created new jobs and opportunities. This sector is becoming increasingly important as the county invests in sustainable energy sources.
Employment by industry, Columbia County 2024 annual average
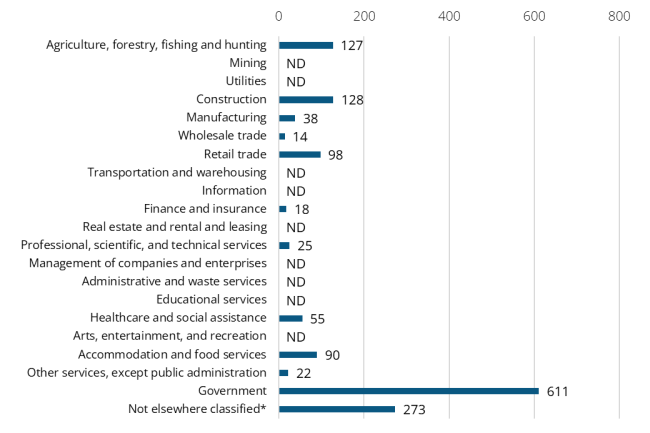
Source: Employment Security Department/Labor Market Information and Research Division, Covered Employment (QCEW)
Note: ND stands for not disclosed. ND is used to avoid disclosing data for individual employers. Industries labeled ND are grouped in the Not elsewhere classified category.
Top five sectors in terms of employment in 2024:
-
Government (611 jobs or 40.6% employment share)
-
Construction (128 jobs or 8.5% employment share)
-
Agriculture (127 jobs or 8.4% employment share)
-
Retail trade (98 jobs or 6.5% employment share)
-
Accommodation and food services (90 jobs or 6.0% employment share)
-
Health care and social assistance (55 jobs or 3.7% employment share)
Wages can vary substantially from one industry sector to another. The average annual wage in Columbia County for all industries was $66,819 with total payroll at $100.4 million in 2024.
Top five sectors in terms of wages in 2024:
-
Construction ($108,460)
-
Government ($64,603)
-
Health care and social assistance ($60,090)
-
Manufacturing ($48,998)
-
Wholesale trade ($47,798)
-
Finance and insurance ($33,183)
Workforce demographics in Columbia County
The labor force participation rate is highest among the 20-24 age group at 91.5%, while the 65-74 age group has the lowest at 22.0%.
Male workers have a slightly higher participation rate (80.2%) compared to female workers (75.4%). People with a bachelor’s degree or higher have the highest participation rate at 92.1%, while those with a high school diploma have the lowest at 76.5%.
Visit the U.S. Census Bureau website for quick facts about Columbia County.
Age
| Demographic characteristic | Total | Labor force participation rate | Unemployment rate |
|---|---|---|---|
| Population 16 years and over | 3,337 | 54.6% | 3.4% |
| 16 to 19 years | 51 | 35.3% | 50.0% |
| 20 to 24 years | 189 | 91.5% | 0.0% |
| 25 to 29 years | 230 | 66.1% | 0.0% |
| 30 to 34 years | 126 | 92.1% | 14.7% |
| 35 to 44 years | 464 | 79.1% | 0.0% |
| 45 to 54 years | 427 | 76.8% | 0.0% |
| 55 to 59 years | 369 | 82.9% | 0.0% |
| 60 to 64 years | 296 | 65.5% | 17.5% |
| 65 to 74 years | 682 | 22.0% | 1.3% |
| 75 years and over | 503 | 3.8% | 0.0% |
Race or Hispanic origin
| Demographic characteristic | Total | Labor force participation rate | Unemployment rate |
|---|---|---|---|
| White alone | 2,730 | 52.1% | 2.5% |
| Black or African American alone | 28 | 96.4% | 33.3% |
| American Indian and Alaska Native alone | 16 | 0.0% | 0.0% |
| Asian alone | 1 | 0.0% | 0.0% |
| Native Hawaiian and other Pacific Islander alone | 0 | 0.0% | 0.0% |
| Some other race alone | 157 | 69.4% | 0.0% |
| Two or more races | 405 | 65.2% | 6.8% |
| Hispanic or Latino origin (of any race) | 256 | 70.7% | 0.0% |
| White alone, not Hispanic or Latino | 2,730 | 52.1% | 2.5% |
| Population 20 to 64 years | 2,101 | 77.9% | 3.1% |
Sex
| Demographic characteristic | Total | Labor force participation rate | Unemployment rate |
|---|---|---|---|
| Male | 1,063 | 80.2% | 2.0% |
| Female | 1,038 | 75.4% | 4.3% |
Females with children
| Demographic characteristic | Total | Labor force participation rate | Unemployment rate |
|---|---|---|---|
| With own children under 18 | 311 | 86.5% | 0.0% |
| With own children under 6 only | 71 | 87.3% | 0.0% |
| With own children under 6 and 6 to 17 | 37 | 75.7% | 0.0% |
| With own children 6 to 17 only | 203 | 88.2% | 0.0% |
Poverty status in the past 12 months
| Demographic characteristic | Total | Labor force participation rate | Unemployment rate |
|---|---|---|---|
| Below poverty level | 234 | 6.0% | 0.0% |
| At or above the poverty level | 1,860 | 87.2% | 3.1% |
Disability status
| Demographic characteristic | Total | Labor force participation rate | Unemployment rate |
|---|---|---|---|
| With any disability | 337 | 43.6% | 0.0% |
Educational attainment
| Demographic characteristic | Total | Labor force participation rate | Unemployment rate |
|---|---|---|---|
| Population 25 to 64 years | 1,912 | 76.5% | 3.5% |
| Less than high school graduate | 272 | 56.6% | 0.0% |
| High school graduate (includes equivalency) | 364 | 62.6% | 0.0% |
| Some college or associate's degree | 781 | 80.0% | 4.8% |
| Bachelor's degree or higher | 495 | 92.1% | 4.6% |
Source: U.S. Census Bureau, American Community Survey 5-year estimates, S2301 | Employment Status
This workforce product was funded by a grant awarded by the U.S. Department of Labor's Employment and Training Administration. The product was created by the recipient and does not necessarily reflect the official position of the U.S. Department of Labor. The Department of Labor makes no guarantees, warranties, or assurances of any kind, expressed or implied, with respect to such information, including any information on linked sites and including, but not limited to, accuracy of the information or its completeness, timeliness, usefulness, adequacy, continued availability, or ownership. This product is copyrighted by the institution that created it. Internal use by an organization and/or personal use by an individual for non-commercial purposes is permissible. All other uses require the prior authorization of the copyright owner.