

Posted October 2025
August 2025 highlights
In August, the not seasonally adjusted unemployment rate increased to 4.5% from 4.3% in July and total nonfarm employment decreased by 11,700.
Summary
The King County economy quickly began to bounce back from the 2020 COVID-19 pandemic. It fully recovered the jobs it lost by June 2022. Most recently, total nonfarm employment growth has slowed as policy makers shifted to contain inflation.
Seattle is the county seat and the state’s largest city in terms of population. Its mix of older industrial companies and internet and technology companies have helped King County become the leading county employer in the state. Much of the tech employment is contained within the information industry. Over the past couple of years employment in this sector has moved from a boom period during the pandemic toward a bust period. In 2024, the information industry shed more jobs in the county than any other industry.
The Boeing Company maintains major production facilities in the Seatle area and in other parts of King County. In fall 2024, roughly 33,000 Boeing employees went on a seven-week strike through their machinist union. The strike showed up in the October numbers as a major loss. The November report reflects workers returning to their jobs.
Location
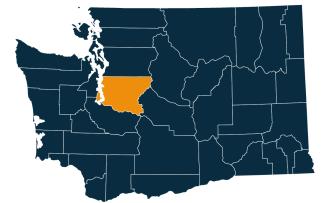
King County is located on Puget Sound in western Washington state. It is bordered on the north by Snohomish County, the northeast by Chelan County, the southeast by Kittitas County, the south by Pierce County and across the Puget Sound on the west by Kitsap County.
King County is one of three Washington counties that make up the Seattle-Tacoma-Bellevue metropolitan statistical area along with Pierce and Snohomish Counties. It is the most populous county in the state.
Employment situation for August 2025
Labor force and unemployment
-
The not seasonally adjusted unemployment rate was 4.5% in August 2025, up from 4.3% in July 2025 and up from 4.3% 12 months ago.
-
The labor force declined from August 2024 to August 2025, losing 6,514 participants (down 0.5%).
Unemployment rate, not seasonally adjusted
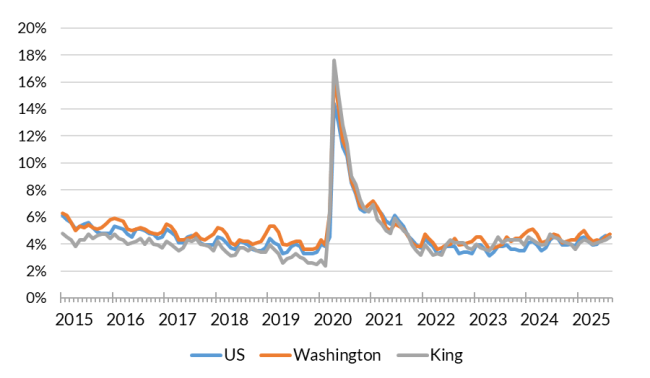
Source: Employment Security Department/Labor Market Information and Research (LMIR) Division, Local area unemployment statistics
Payroll employment
-
Total nonfarm employment decreased by 11,700 from July 2025 to August 2025.
-
Overall, employment growth declined over the year and has been slowing.
-
Over the month, employment increased in two major industry sectors, decreased in nine and was unchanged in two. The largest increase was in construction. The largest loss was in information.
-
From August 2024 to August 2025, total nonfarm employment fell by 13,500 (0.9%).
-
Over the year, employment in five major industries expanded, seven contracted and one was unchanged.
-
Employment in private education and health services increased the most while employment in professional and business services declined the most.
Nonfarm employment estimates, not seasonally adjusted, King County
| NAICS Industry Title | Aug 2025 (Prelim) | Jul 2025 (Revised) | Aug 2024 (Revised) | Jul 2025 to Aug 2025 Change | Aug 2024 to Aug 2025 Change | Aug 2024 to Aug 2025 % Change |
|---|---|---|---|---|---|---|
| Total nonfarm | 1,482,200 | 1,493,900 | 1,495,700 | -11,700 | -13,500 | -0.9% |
| Total private (total nonfarm less government) | 1,305,700 | 1,312,600 | 1,315,400 | -6,900 | -9,700 | -0.7% |
| Goods-producing | 170,300 | 171,000 | 169,600 | -700 | 700 | 0.4% |
| - Mining and logging | 400 | 400 | 400 | 0 | 0 | 0.0% |
| - Construction | 75,100 | 74,600 | 74,900 | 500 | 200 | 0.3% |
| - Manufacturing | 94,800 | 96,000 | 94,300 | -1,200 | 500 | 0.5% |
| Service-providing | 1,311,900 | 1,322,900 | 1,326,100 | -11,000 | -14,200 | -1.1% |
| - Wholesale trade | 59,400 | 59,600 | 60,900 | -200 | -1,500 | -2.5% |
| - Retail trade | 104,100 | 104,500 | 105,100 | -400 | -1,000 | -1.0% |
| - Transportation, warehousing, and utilities | 18,600 | 18,800 | 19,000 | -200 | -400 | -2.1% |
| - Information | 127,900 | 129,800 | 132,200 | -1,900 | -4,300 | -3.3% |
| - Financial activities | 40,800 | 41,100 | 41,300 | -300 | -500 | -1.2% |
| - Professional and business services | 148,600 | 149,700 | 155,500 | -1,100 | -6,900 | -4.4% |
| - Private education and health services | 33,400 | 33,200 | 31,100 | 200 | 2,300 | 7.4% |
| - Leisure and hospitality | 32,300 | 32,400 | 30,300 | -100 | 2,000 | 6.6% |
| - Other services | 9,200 | 9,200 | 8,700 | 0 | 500 | 5.7% |
| - Government | 18,300 | 18,500 | 19,100 | -200 | -800 | -4.2% |
Note: Data benchmarked through March 2025, updated September 15, 2025.
Source: Employment Security Department/Labor Market Information and Research Division, Washington employment estimates (WA-QB & CES)
Detailed tables can be found on the source page in the third spreadsheet titled Current employment estimates, not seasonally adjusted.
Industry employment (covered employment)
King County leads all other counties in total employment. Private sector employment accounts for about 90% of the total. The county’s largest city, Seattle, is effectively the heart of the economy. Health care is the leading private sector employer in King County as Seattle is the headquarters for many global health organizations.
Beginning in the 1980s, the Seattle area developed into a technology center. The stream of new software, biotechnology and internet companies helped move the professional, scientific and technical services sector into the second largest industry employer, and information into the third largest.
King County’s large population has encouraged employment growth in retail trade and accommodation and food services. Truck and aerospace manufacturing have also bolstered employment in the manufacturing sector.
Employment by industry, King County 2024 annual average
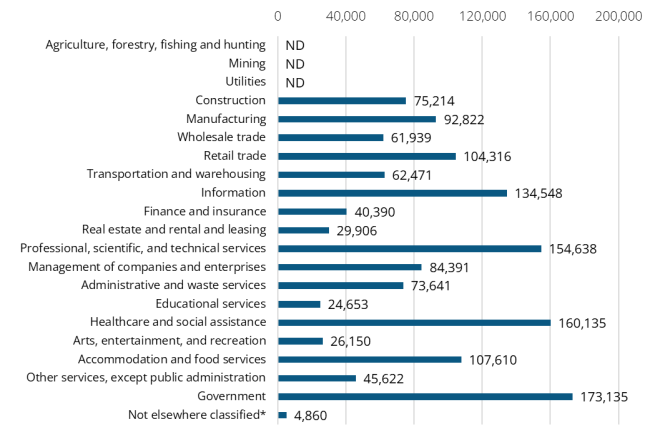
Source: Employment Security Department/Labor Market Information and Research (LMIR) Division, Covered Employment (QCEW)
Average annual covered employment in King County was 1,449,797. Covered employment refers to workers who received wages in Washington state and are eligible for state and federal unemployment insurance (UI) compensation programs.
Top five sectors in terms of employment in 2024:
-
Government (178,581)
-
Health care and social assistance (164,376)
-
Professional, scientific and technical services (150,802)
-
Information (128,749)
-
Accommodation and food services (109,122)
Wages can vary substantially from one industry sector to another. The average annual wage in Washington state for all industries was $92,467 in 2024. The average annual wage in King County was $132,276 in 2024.
The top five sectors in terms of wages in 2024:
-
Information ($350,208)
-
Management of companies and enterprises ($302,336)
-
Professional, scientific and technical services ($173,302)
-
Finance and insurance ($172,119)
-
Wholesale trade ($137,247)
Workforce demographics for King County
Age
| Demographic characteristic | Total | Labor force participation rate | Unemployment rate |
|---|---|---|---|
| Population 16 years and over | 1,864,459 | 70.1% | 4.6% |
| 16 to 19 years | 97,794 | 37.7% | 15.0% |
| 20 to 24 years | 132,192 | 77.8% | 8.2% |
| 25 to 29 years | 196,893 | 88.4% | 4.5% |
| 30 to 34 years | 215,322 | 87.7% | 4.3% |
| 35 to 44 years | 358,298 | 86.1% | 3.9% |
| 45 to 54 years | 293,485 | 85.1% | 3.5% |
| 55 to 59 years | 132,462 | 77.4% | 3.6% |
| 60 to 64 years | 126,645 | 63.0% | 3.6% |
| 65 to 74 years | 187,744 | 29.8% | 3.8% |
| 75 years and over | 123,624 | 6.6% | 3.9% |
Race or Hispanic origin
| Demographic characteristic | Total | Labor force participation rate | Unemployment rate |
|---|---|---|---|
| White alone | 1,102,165 | 68.3% | 4.4% |
| Black or African American alone | 115,064 | 70.1% | 7.8% |
| American Indian and Alaska Native alone | 11,177 | 66.8% | 6.2% |
| Asian alone | 379,899 | 72.2% | 3.1% |
| Native Hawaiian and other Pacific Islander alone | 13,091 | 72.8% | 6.6% |
| Some other race alone | 81,636 | 76.5% | 5.6% |
| Two or more races | 161,427 | 73.8% | 6.2% |
| Hispanic or Latino origin (of any race) | 176,272 | 76.4% | 5.1% |
| White alone, not Hispanic or Latino | 1,063,192 | 68.0% | 4.4% |
| Population 20 to 64 years | 1,455,297 | 82.9% | 4.3% |
Sex
| Demographic characteristic | Total | Labor force participation rate | Unemployment rate |
|---|---|---|---|
| Male | 752,680 | 88.0% | 4.4% |
| Female | 702,617 | 77.4% | 4.2% |
Females with children
| Demographic characteristic | Total | Labor force participation rate | Unemployment rate |
|---|---|---|---|
| With own children under 18 | 227,645 | 73.2% | 3.8% |
| With own children under 6 only | 56,962 | 72.0% | 3.5% |
| With own children under 6 and 6 to 17 | 39,256 | 62.8% | 4.2% |
| With own children 6 to 17 only | 131,427 | 76.8% | 3.9% |
Poverty status in the past 12 months
| Demographic characteristic | Total | Labor force participation rate | Unemployment rate |
|---|---|---|---|
| Below poverty level | 113,066 | 48.1% | 24.2% |
| At or above the poverty level | 1,332,950 | 86.2% | 3.3% |
Disability status
| Demographic characteristic | Total | Labor force participation rate | Unemployment rate |
|---|---|---|---|
| With any disability | 113,886 | 57.7% | 10.4% |
Educational attainment
| Demographic characteristic | Total | Labor force participation rate | Unemployment rate |
|---|---|---|---|
| Population 25 to 64 years | 1,323,105 | 83.4% | 3.9% |
| Less than high school graduate | 76,288 | 68.9% | 7.2% |
| High school graduate (includes equivalency) | 178,879 | 75.7% | 6.1% |
| Some college or associate's degree | 299,536 | 80.1% | 5.0% |
| Bachelor's degree or higher | 768,402 | 87.9% | 2.8% |
Source: U.S. Census Bureau, American Community Survey, S2301 | Employment Status
This workforce product was funded by a grant awarded by the U.S. Department of Labor's Employment and Training Administration. The product was created by the recipient and does not necessarily reflect the official position of the U.S. Department of Labor. The Department of Labor makes no guarantees, warranties, or assurances of any kind, expressed or implied, with respect to such information, including any information on linked sites and including, but not limited to, accuracy of the information or its completeness, timeliness, usefulness, adequacy, continued availability, or ownership. This product is copyrighted by the institution that created it. Internal use by an organization and/or personal use by an individual for non-commercial purposes is permissible. All other uses require the prior authorization of the copyright owner.