

Posted October 2025
August 2025 highlights
From July to August, the not seasonally adjusted unemployment rate was unchanged at 5.5% and total nonfarm employment increased by 120 jobs.
Summary
Lewis County is a large, centrally located county in southwest Washington. It is a gateway between lumber producing regions and major transportation routes. Wood product manufacturing is a major industry. In recent years, Lewis County has also become a major center of trade, transportation and warehousing. Other major industries include government, health care and social assistance, retail trade, and accommodation and food services.
During the COVID-19 pandemic, the unemployment rate in Lewis County hit a peak of 17.2%. In subsequent years unemployment has improved, though it still tends to be higher than the statewide average.
Location
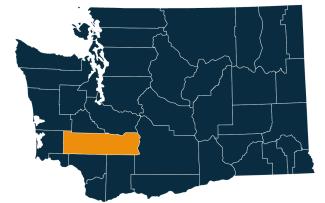
Lewis County is located in southwest Washington. It is well connected along Interstate 5, and shares borders with eight neighboring counties. These are Grays Harbor, Thurston, and Pierce counties to the north, Yakima to the east, Wahkiakum, Cowlitz and Skamania to the south, and Pacific to the west.
Lewis County ‘s largest city is Centralia. The county is part of the Pacific Mountain Workforce Development Area. Visit the Workforce Training & Education Coordinating Board website for information about the 12 workforce regions.
Employment situation for August 2025
Labor force and unemployment
-
The not seasonally adjusted unemployment rate was 5.5% in August 2025. This was unchanged from the previous month and down from 5.9% in August 2024.
-
The total civilian labor force was 33,290 in August 2025, down from 33,682 in August 2024.
-
There were 1,820 unemployed persons in August 2025, 159 fewer than in August 2024.
Unemployment rate, not seasonally adjusted
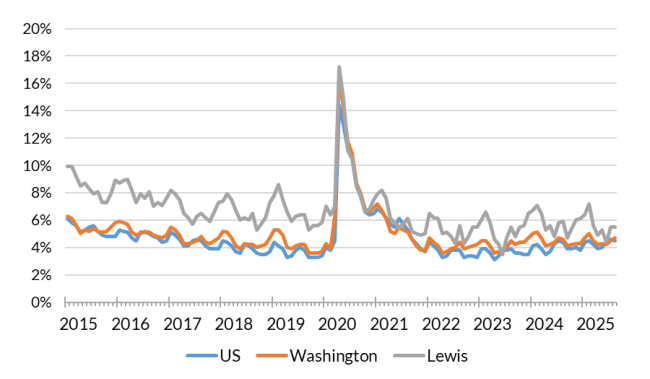
Source: Employment Security Department/Labor Market Information and Research Division, Local area unemployment statistics
Payroll employment
-
Total nonfarm employment was 26,760 in August 2025, not seasonally adjusted. This was up by 120 jobs from the previous month, and down by 160 jobs (0.6%) from August 2024.
-
Over the course of 12 months, ending in August 2025, goods producing industries lost 130 jobs (2.5%) and service providing industries lost 30 jobs (0.1%).
-
The largest increase over the year was in government, which added 240 jobs.
-
The largest decrease over the year was in leisure and hospitality (down 100 jobs). This was followed by construction (down 80 jobs), wholesale trade (down 80 jobs) and private education and health services (down 80 jobs).
Nonfarm employment estimates, not seasonally adjusted, Lewis County
| NAICS Industry Title | Aug 2025 (Prelim) | Jul 2025 (Revised) | Aug 2024 (Revised) | Jul 2025 to Aug 2025 Change | Aug 2024 to Aug 2025 Change | Aug 2024 to Aug 2025 % Change |
|---|---|---|---|---|---|---|
| Total nonfarm | 26,760 | 26,640 | 26,920 | 120 | -160 | -0.6% |
| Total private (total nonfarm less government) | 21,970 | 21,950 | 22,370 | 20 | -400 | -1.8% |
| Goods-producing | 5,070 | 5,060 | 5,200 | 10 | -130 | -2.5% |
| - Mining and logging | 430 | 420 | 450 | 10 | -20 | -4.4% |
| - Construction | 1,330 | 1,320 | 1,410 | 10 | -80 | -5.7% |
| - Manufacturing | 3,310 | 3,320 | 3,350 | -10 | -40 | -1.2% |
| Service-providing | 21,690 | 21,580 | 21,720 | 110 | -30 | -0.1% |
| - Wholesale trade | 1,400 | 1,440 | 1,480 | -40 | -80 | -5.4% |
| - Retail trade | 3,660 | 3,670 | 3,640 | -10 | 20 | 0.5% |
| - Transportation, warehousing, and utilities | 1,560 | 1,590 | 1,620 | -30 | -60 | -3.7% |
| - Information | 180 | 180 | 180 | 0 | 0 | 0.0% |
| - Financial activities | 690 | 680 | 690 | 10 | 0 | 0.0% |
| - Professional and business services | 1,480 | 1,460 | 1,460 | 20 | 20 | 1.4% |
| - Private education and health services | 4,500 | 4,470 | 4,580 | 30 | -80 | -1.7% |
| - Leisure and hospitality | 2,790 | 2,780 | 2,890 | 10 | -100 | -3.5% |
| - Other services | 630 | 620 | 630 | 10 | 0 | 0.0% |
| - Government | 4,790 | 4,690 | 4,550 | 100 | 240 | 5.3% |
Note: Data benchmarked through March 2025, updated September 15, 2025.
Source: Employment Security Department/Labor Market Information and Research Division, Washington employment estimates (WA-QB & CES)
Detailed tables can be found on the source page in the third spreadsheet titled Current employment estimates, not seasonally adjusted.
Industry employment (covered employment)
Employment by industry, Lewis County 2024 annual average
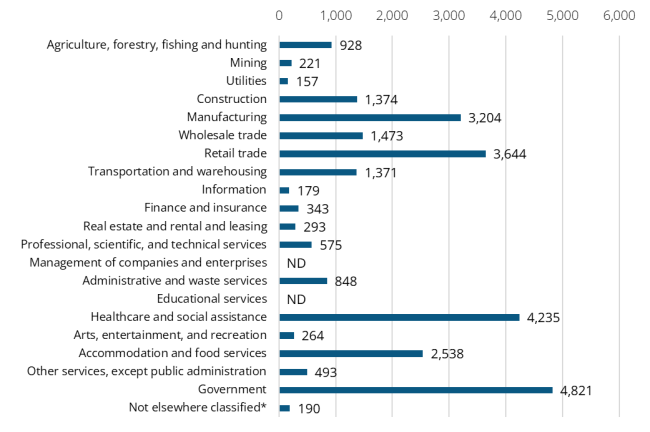
Source: Employment Security Department/Labor Market Information and Research Division, Covered Employment (QCEW)
Average annual covered employment in Lewis County was 27,150 in 2024. This was little changed from 27,268 in 2023. Covered employment refers to workers who received wages in Washington state and are eligible for state and federal unemployment insurance (UI) compensation programs.
Top five sectors in terms of employment in 2024:
-
Government (4,821)
-
Health care and social assistance (4,235)
-
Retail trade (3,644)
-
Manufacturing (3,204)
-
Accommodation and food services (2,538)
The average annual wage in Lewis County was $58,702 in 2024. This was up from $55,149 in 2023, a 6.4% increase. Except for manufacturing, the industries with the highest wages in the county tend to be small.
Top five sectors in terms of wages in 2024:
-
Utilities ($141,993)
-
Mining ($83,738)
-
Finance and insurance ($75,620)
-
Information ($74,242)
-
Manufacturing ($71,284)
Workforce demographics for Lewis County
Employment status varies across demographic groups, with overall labor force participation (55.3%) driven by older workers exiting the workforce. Among the population aged 20-64, men tend to have higher labor force participation (77.7% vs. 65.2%) and higher unemployment (6.3% vs. 4.0%), though women with children under age 6 have the most difficulty finding work at 8.4% unemployment. Workers with less than a high school diploma have a much higher unemployment rate (9.0%) compared to those with a high school diploma or higher. Visit the U.S. Census Bureau website for quick facts about Lewis County.
Age
| Demographic characteristic | Total | Labor force participation rate | Unemployment rate |
|---|---|---|---|
| Population 16 years and over | 67,977 | 55.3% | 5.9% |
| 16 to 19 years | 3,923 | 45.4% | 22.3% |
| 20 to 24 years | 4,160 | 75.3% | 14.1% |
| 25 to 29 years | 4,969 | 73.7% | 6.8% |
| 30 to 34 years | 5,143 | 79.1% | 4.9% |
| 35 to 44 years | 10,250 | 73.3% | 4.8% |
| 45 to 54 years | 9,861 | 76.3% | 2.6% |
| 55 to 59 years | 5,455 | 65.2% | 2.1% |
| 60 to 64 years | 6,437 | 56.5% | 6.1% |
| 65 to 74 years | 10,792 | 22.1% | 3.4% |
| 75 years and over | 6,987 | 4.8% | 2.7% |
Race or Hispanic origin
| Demographic characteristic | Total | Labor force participation rate | Unemployment rate |
|---|---|---|---|
| White alone | 58,471 | 54.0% | 5.8% |
| Black or African American alone | 498 | 50.4% | 3.6% |
| American Indian and Alaska Native alone | 667 | 49.8% | 7.2% |
| Asian alone | 831 | 75.8% | 7.5% |
| Native Hawaiian and other Pacific Islander alone | 183 | 60.1% | 0.0% |
| Some other race alone | 1,849 | 62.0% | 0.0% |
| Two or more races | 5,478 | 64.5% | 8.5% |
| Hispanic or Latino origin (of any race) | 6,003 | 71.6% | 5.2% |
| White alone, not Hispanic or Latino | 56,770 | 53.2% | 5.9% |
| Population 20 to 64 years | 46,275 | 71.5% | 5.3% |
Sex
| Demographic characteristic | Total | Labor force participation rate | Unemployment rate |
|---|---|---|---|
| Male | 23,373 | 77.7% | 6.3% |
| Female | 22,902 | 65.2% | 4.0% |
Females with children
| Demographic characteristic | Total | Labor force participation rate | Unemployment rate |
|---|---|---|---|
| With own children under 18 | 8,012 | 69.5% | 3.6% |
| With own children under 6 only | 1,520 | 56.4% | 8.4% |
| With own children under 6 and 6 to 17 | 1,958 | 56.8% | 0.0% |
| With own children 6 to 17 only | 4,534 | 79.4% | 3.6% |
Poverty status in the past 12 months
| Demographic characteristic | Total | Labor force participation rate | Unemployment rate |
|---|---|---|---|
| Below poverty level | 6,140 | 37.6% | 20.1% |
| At or above the poverty level | 39,897 | 77.1% | 4.1% |
Disability status
| Demographic characteristic | Total | Labor force participation rate | Unemployment rate |
|---|---|---|---|
| With any disability | 8,029 | 42.6% | 10.7% |
Educational attainment
| Demographic characteristic | Total | Labor force participation rate | Unemployment rate |
|---|---|---|---|
| Population 25 to 64 years | 42,115 | 71.1% | 4.3% |
| Less than high school graduate | 4,090 | 60.1% | 9.0% |
| High school graduate (includes equivalency) | 13,457 | 63.3% | 5.9% |
| Some college or associate's degree | 16,245 | 73.7% | 3.6% |
| Bachelor's degree or higher | 8,323 | 84.2% | 2.0% |
Source: U.S. Census Bureau, American Community Survey 5-year estimates, S2301 | Employment Status.
This workforce product was funded by a grant awarded by the U.S. Department of Labor's Employment and Training Administration. The product was created by the recipient and does not necessarily reflect the official position of the U.S. Department of Labor. The Department of Labor makes no guarantees, warranties, or assurances of any kind, expressed or implied, with respect to such information, including any information on linked sites and including, but not limited to, accuracy of the information or its completeness, timeliness, usefulness, adequacy, continued availability, or ownership. This product is copyrighted by the institution that created it. Internal use by an organization and/or personal use by an individual for non-commercial purposes is permissible. All other uses require the prior authorization of the copyright owner.