

August 2025 highlights
In August, the not seasonally adjusted monthly unemployment rate remained unchanged at 5.3%. Total nonfarm employment decreased by 30 jobs in Lincoln County from August 2024 to August 2025.
Summary
Lincoln County lies in the Channeled Scablands of Eastern Washington. Around 11,862 people live in Lincoln County as of 2024, with approximately 26.7% of the population aged 65 years and older. The labor force has 3,956 workers with an unemployment rate of 5.3% in August 2025. The preliminary total nonfarm employment during August 2025 was 2,610 jobs.
Government is the largest employment sector in Lincoln County, followed by construction, agriculture, forestry, fishing and hunting and retail trade. Lincoln County is the second-largest producer of wheat in the United States, behind Whitman County.
Lincoln County geographic overview
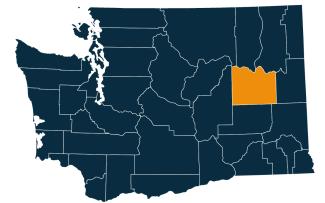
Lincoln County is in the eastern part of Washington state. It is known for its rich agricultural heritage. The city of Davenport serves as the county seat and is also the largest city in Lincoln County.
The county covers 2,339 square miles, including 36 square miles of water. It features a diverse landscape with rolling wheat fields, river valleys and the scenic shores of Lake Roosevelt.
Lincoln County was created out of Whitman County in 1883 and is named after Abraham Lincoln, the 16th president of the United States.
Washington has 12 regional Workforce Development Areas. Lincoln County is part of Area 10, the Eastern Washington Partnership. Visit the Workforce Training & Education Coordinating Board website for information about the 12 regions.
Lincoln County employment situation for August 2025
Monthly labor force and unemployment
- The not seasonally adjusted unemployment rate was 5.3% during August 2025, down from 6.0% in August 2024.
- The labor force decreased by 8 workers from August 2024 to August 2025.
- The total employed workers increased by 21 workers from August 2024 to August 2025
Unemployment rate, not seasonally adjusted
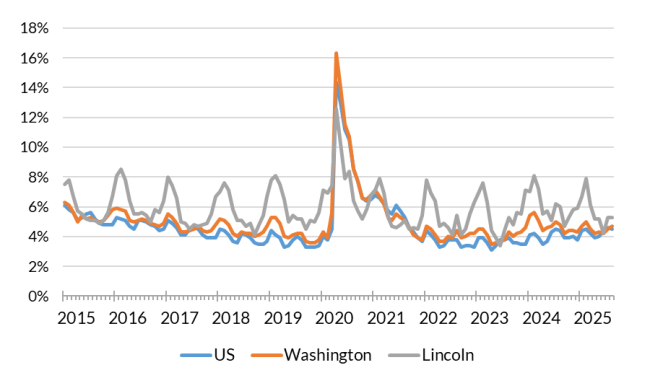
Source: Employment Security Department/Labor Market Information and Research Division, Local area unemployment statistics
Monthly nonfarm payroll employment in Lincoln County, Washington
-
Total nonfarm employment in Lincoln County was 2,610 jobs in August 2025. Total nonfarm employment decreased by 20 jobs over the month and decreased by 30 jobs over the year. Total private sectors decreased by 10 jobs from August 2024 to August 2025, for a total of 1,290 jobs.
- Goods producing sectors, with 330 jobs, decreased by 10 jobs over the month but remained unchanged from August 2024.
- The largest group in this sector is construction, with 310 jobs, increased by 10 jobs from August 2024 to August 2025.
- Service providing sectors, with 2,280 jobs, decreased by 10 jobs over the month and decreased by 30 jobs from August 2024.
- Wholesale trade, with a total of 160 jobs in August 2025, increased by 10 jobs over the month but decreased by 10 jobs over the year.
- Professional and business services remained unchanged over the month and over the year, with a total of 180 jobs.
- Leisure and hospitality, with a total of 180 jobs, decreased by 10 jobs over the month but increased by 10 jobs over the year.
- Government services, with a total of 1,320 jobs including public educational services, decreased by 10 jobs over the month and decreased by 20 jobs from August 2024.
Nonfarm employment estimates, not seasonally adjusted, Lincoln County
| NAICS Industry Title | Aug 2025 (Prelim) | Jul 2025 (Revised) | Aug 2024 (Revised) | Jul 2025 to Aug 2025 Change | Aug 2024 to Aug 2025 Change | Aug 2024 to Aug 2025 % Change |
|---|---|---|---|---|---|---|
| Total nonfarm | 2,610 | 2,630 | 2,640 | -20 | -30 | -1.1% |
| Total private (total nonfarm less government) | 1,290 | 1,300 | 1,300 | -10 | -10 | -0.8% |
| Goods-producing | 330 | 340 | 330 | -10 | 0 | 0.0% |
| - Mining, logging and construction | 310 | 310 | 300 | 0 | 10 | 3.3% |
| - Manufacturing | 20 | 20 | 20 | 0 | 0 | 0.0% |
| Service-providing | 2,280 | 2,290 | 2,310 | -10 | -30 | -1.3% |
| - Wholesale trade | 160 | 150 | 170 | 10 | -10 | -5.9% |
| - Retail trade | 120 | 120 | 140 | 0 | -20 | -14.3% |
| - Transportation, warehousing, and utilities | 90 | 90 | 90 | 0 | 0 | 0.0% |
| - Information | 10 | 0 | 10 | 10 | 0 | 0.0% |
| - Financial activities | 50 | 50 | 50 | 0 | 0 | 0.0% |
| - Professional and business services | 180 | 180 | 180 | 0 | 0 | 0.0% |
| - Private education and health services | 110 | 100 | 100 | 10 | 10 | 10.0% |
| - Leisure and hospitality | 180 | 190 | 170 | -10 | 10 | 5.9% |
| - Other services | 70 | 70 | 70 | 0 | 0 | 0.0% |
| - Government | 1,320 | 1,330 | 1,340 | -10 | -20 | -1.5% |
Note: Data benchmarked through March 2025, updated September 15, 2025.
Source: Employment Security Department/Labor Market Information and Research Division, Washington employment estimates (WA-QB & CES)
Detailed tables can be found on the source page in the third spreadsheet titled Current employment estimates, not seasonally adjusted.
Total covered employment
Employment by industry, Lincoln County 2024 annual average
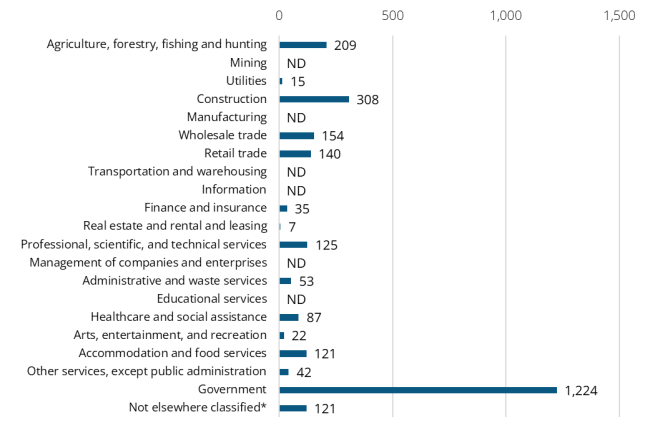
Source: Employment Security Department/Labor Market Information and Research Division, Covered Employment (QCEW)
Average annual covered employment in Lincoln County was 2,662 in 2024. Covered employment refers to workers who received wages in Washington state and are eligible for state and federal unemployment insurance (UI) compensation programs.
Wages can vary substantially from one industry sector to another. The average annual wage in Washington state for all industries was $92,467 in 2024. The average annual wage in Lincoln County was $54,323 in 2024.
Top five sectors by total employment counts during 2024:
- Government (1,224)
- Construction (308)
- Agriculture, forestry, fishing and hunting (209)
- Wholesale trade (154)
- Retail trade (140)
Top five sectors by average annual wages during 2024:
- Utilities ($98,304)
- Construction ($70,051)
- Finance and insurance ($69,043)
- Healthcare and social assistance ($62,031)
- Professional, scientific and technical services ($59,664)
Workforce demographics in Lincoln County
The labor force participation rate is highest among the 35 to 39 years age group at 83.7%, while the 65 to 74 age group has the lowest at 24.6%. Participation rate for labor force prime working population 20 to 64 years of age was 73.8%.
Male workers have a slightly higher participation rate (78.3%) compared to female workers (69.2%). Those with a bachelor’s degree or higher have the highest participation rate at 85.9%, while those with less than a high school diploma have the lowest at 48.6%.
Visit the U.S. Census Bureau website for more quick facts about Lincoln County.
Age
| Demographic characteristic | Total | Labor force participation rate | Unemployment rate |
|---|---|---|---|
| Population 16 years and over | 9,146 | 53.4% | 5.5% |
| 16 to 19 years | 558 | 34.9% | 19.5% |
| 20 to 24 years | 519 | 72.1% | 16.8% |
| 25 to 29 years | 462 | 72.7% | 5.1% |
| 30 to 34 years | 480 | 83.1% | 4.1% |
| 35 to 44 years | 1,243 | 83.7% | 3.9% |
| 45 to 54 years | 1,245 | 81.6% | 5.5% |
| 55 to 59 years | 723 | 62.2% | 6.4% |
| 60 to 64 years | 1,005 | 57.4% | 0.9% |
| 65 to 74 years | 1,763 | 24.6% | 0.0% |
| 75 years and over | 1,148 | 5.5% | 4.8% |
Race or Hispanic origin
| Demographic characteristic | Total | Labor force participation rate | Unemployment rate |
|---|---|---|---|
| White alone | 8,389 | 53.2% | 5.4% |
| Black or African American alone | 59 | 50.8% | 56.7% |
| American Indian and Alaska Native alone | 204 | 43.1% | 0.0% |
| Asian alone | 71 | 43.7% | 6.5% |
| Native Hawaiian and other Pacific Islander alone | 21 | 95.2% | 0.0% |
| Some other race alone | 108 | 78.7% | 0.0% |
| Two or more races | 294 | 57.1% | 3.7% |
| Hispanic or Latino origin (of any race) | 318 | 66.4% | 11.8% |
| White alone, not Hispanic or Latino | 8,289 | 52.9% | 5.4% |
| Population 20 to 64 years | 5,677 | 73.8% | 5.4% |
Sex
| Demographic characteristic | Total | Labor force participation rate | Unemployment rate |
|---|---|---|---|
| Male | 2,868 | 78.3% | 4.8% |
| Female | 2,809 | 69.2% | 6.2% |
Females with children
| Demographic characteristic | Total | Labor force participation rate | Unemployment rate |
|---|---|---|---|
| With own children under 18 | 940 | 72.1% | 5.9% |
| With own children under 6 only | 150 | 50.7% | 22.4% |
| With own children under 6 and 6 to 17 | 272 | 65.1% | 0.0% |
| With own children 6 to 17 only | 518 | 82.0% | 5.4% |
Poverty status in the past 12 months
| Demographic characteristic | Total | Labor force participation rate | Unemployment rate |
|---|---|---|---|
| Below poverty level | 563 | 39.6% | 12.6% |
| At or above the poverty level | 5,077 | 78.2% | 5.0% |
Disability status
| Demographic characteristic | Total | Labor force participation rate | Unemployment rate |
|---|---|---|---|
| With any disability | 1,028 | 52.4% | 10.4% |
Educational attainment
| Demographic characteristic | Total | Labor force participation rate | Unemployment rate |
|---|---|---|---|
| Population 25 to 64 years | 5,158 | 74.0% | 4.3% |
| Less than high school graduate | 354 | 48.6% | 14.5% |
| High school graduate (includes equivalency) | 1,347 | 68.2% | 7.0% |
| Some college or associate's degree | 2,195 | 74.9% | 2.9% |
| Bachelor's degree or higher | 1,262 | 85.9% | 2.6% |
Source: U.S. Census Bureau, American Community Survey 5-year estimates, S2301 | Employment Status
This workforce product was funded by a grant awarded by the U.S. Department of Labor's Employment and Training Administration. The product was created by the recipient and does not necessarily reflect the official position of the U.S. Department of Labor. The Department of Labor makes no guarantees, warranties, or assurances of any kind, expressed or implied, with respect to such information, including any information on linked sites and including, but not limited to, accuracy of the information or its completeness, timeliness, usefulness, adequacy, continued availability, or ownership. This product is copyrighted by the institution that created it. Internal use by an organization and/or personal use by an individual for non-commercial purposes is permissible. All other uses require the prior authorization of the copyright owner.