

August 2025 highlights
In August 2025, the not seasonally adjusted unemployment rate was 4.6% over the month, a 0.1% increase from last month. The total nonfarm employment decreased by 1,500 jobs over the month.
Summary
The not seasonally adjusted unemployment rate was 4.6% in August 2025. One year ago, the unemployment rate was 4.2%. There were approximately 1,880 workers that filed an initial claim for unemployment insurance during August 2025. The labor force in Snohomish County had 462,800 workers in August 2025. The labor force estimate is lower than last year by 5,585 workers. Total nonfarm employment decreased by 1,500 jobs over the month, with total nonfarm employment in Snohomish County remaining below last year by 6,600 jobs. Aerospace product and part manufacturing was down 400 jobs over the month and 2,000 jobs below last year’s count.
Location
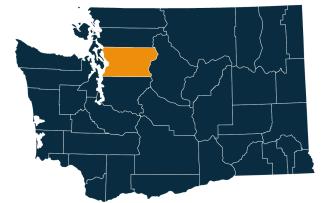
Snohomish County is situated between northern Puget Sound to the west and the crest line of the North Cascade Range to the east. It shares its northern border with rural Skagit County and its south border with King County. Snohomish County is separated from Camano Island (part of Island County) by Davis Slough. The highest point in Snohomish County is Granite Peak (10,541 feet).
The county ranks 13th statewide in terms of total land area (2,087.3 square miles). The geographic distribution of population, economic activity and land use in Snohomish County is diverse, with a mix of rural and urban zones. Population centers are oriented south near the border with King County and west along Interstate 5. By contrast, north and east Snohomish County is characterized by smaller towns and cities, farmland and reservations.
Snohomish County is part of the three-county Seattle-Tacoma-Bellevue MSA and part of the Seattle-Bellevue-Everett Metropolitan Division. Snohomish County is the only county in the Snohomish Workforce Development Area. Visit the Workforce Training & Education Coordinating Board website for information about the 12 regions.
Employment situation for August 2025
Labor force and unemployment
-
The not seasonally adjusted unemployment rate was 4.6% in August 2025, increasing 0.1% from July 2025, and 0.4% above a year ago.
- The labor force grew by 736 workers over the month to 462,800 workers and was 5,585 workers smaller than last year.
Unemployment rate, not seasonally adjusted
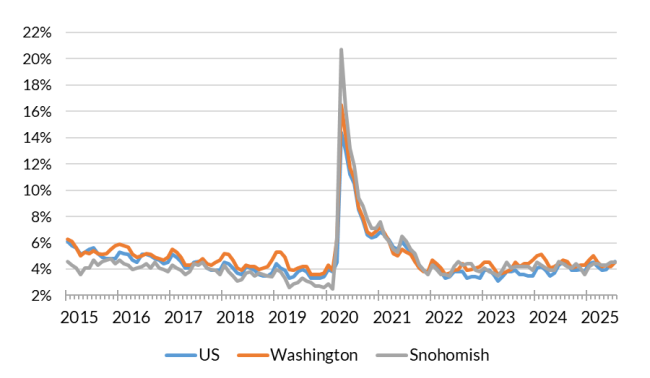
Source: Employment Security Department/Labor Market Information and Research Division, Local area unemployment statistics
Payroll employment
- Nonfarm employment in Snohomish County, at 301,500 jobs, decreased 1,500 jobs over the month and 6,600 jobs over the year.
- Mining, logging and construction increased by 300 jobs over the month but was 1,100 jobs below last year’s figure.
- Aerospace product and part manufacturing decreased by 400 jobs over the month but was lower than last year by 2,000 jobs.
- Retail trade was unchanged over the month but was 900 jobs lower than last year.
- The transportation, warehousing and utilities industry sector was unchanged over the month but was 800 jobs above last year’s figure.
- Information was unchanged over the month but was 300 jobs above last year’s count.
- Professional and business services was unchanged over the month but was 2,700 jobs below last year’s count.
- Private education and health services increased by 100 jobs over the month and 600 jobs above last year’s count.
- Leisure and hospitality lost 600 jobs over the month and was 1,200 jobs below last year’s tally.
Nonfarm employment estimates, not seasonally adjusted, Snohomish County
| NAICS Industry Title | Aug 2025 (Prelim) | Jul 2025 (Revised) | Aug 2024 (Revised) | Jul 2025 to Aug 2025 Change | Aug 2024 to Aug 2025 Change | Aug 2024 to Aug 2025 % Change |
|---|---|---|---|---|---|---|
| Total nonfarm | 301,500 | 303,000 | 308,100 | -1,500 | -6,600 | -2.1% |
| Total private (total nonfarm less government) | 261,400 | 261,600 | 268,200 | -200 | -6,800 | -2.5% |
| Goods-producing | 82,600 | 82,300 | 85,300 | 300 | -2,700 | -3.2% |
| - Mining, logging and construction | 26,000 | 25,700 | 27,100 | 300 | -1,100 | -4.1% |
| - Manufacturing | 56,600 | 56,600 | 58,200 | 0 | -1,600 | -2.7% |
| Service-providing | 218,900 | 220,700 | 222,800 | -1,800 | -3,900 | -1.8% |
| - Wholesale trade | 11,000 | 11,000 | 9,500 | 0 | 1,500 | 15.8% |
| - Retail trade | 34,300 | 34,300 | 35,200 | 0 | -900 | -2.6% |
| - Transportation, warehousing, and utilities | 8,700 | 8,700 | 7,900 | 0 | 800 | 10.1% |
| - Information | 3,800 | 3,800 | 3,500 | 0 | 300 | 8.6% |
| - Financial activities | 11,700 | 11,800 | 12,800 | -100 | -1,100 | -8.6% |
| - Professional and business services | 30,300 | 30,300 | 33,000 | 0 | -2,700 | -8.2% |
| - Private education and health services | 40,800 | 40,700 | 40,200 | 100 | 600 | 1.5% |
| - Leisure and hospitality | 28,800 | 29,400 | 30,000 | -600 | -1,200 | -4.0% |
| - Other services | 7,800 | 7,700 | 10,700 | 100 | -2,900 | -27.1% |
| - Government | 40,100 | 41,400 | 39,900 | -1,300 | 200 | 0.5% |
Note: Data benchmarked through March 2025, updated September 15, 2025.
Source: Employment Security Department/Labor Market Information and Research Division, Washington employment estimates (WA-QB & CES)
Detailed tables can be found on the source page in the third spreadsheet titled Current employment estimates, not seasonally adjusted.
Industry employment (covered employment)
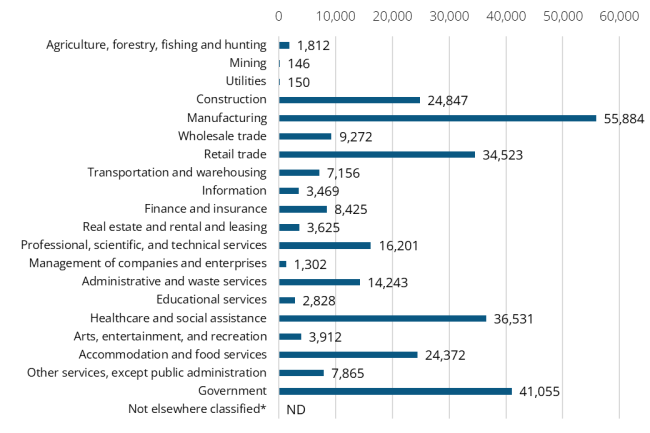
Employment by industry, Snohomish County 2024 annual average
Source: Employment Security Department/Labor Market Information and Research Division, Covered Employment (QCEW)
Average annual covered employment in Snohomish County was 297,617 in 2024. Covered employment refers to workers who received wages in Washington state and are eligible for state and federal unemployment insurance (UI) compensation programs.
The average annual wage in Washington state for all industries was $92,467 in 2024. The average annual wage in Snohomish County was $79,964 in 2024.
Top sectors in terms of employment in 2024:
- Manufacturing (55,884)
- Government (41,055)
- Health care and social assistance (36,531)
- Retail trade (34,523)
- Construction (24,847)
Top sectors in terms of average annual wages in 2024:
- Professional, scientific and technical services ($136,655)
- Information ($125,996)
- Utilities ($122,132)
- Manufacturing ($117,339)
- Finance and insurance ($116,681)
Workforce demographics in Snohomish County
Age
| Demographic characteristic | Total | Labor force participation rate | Unemployment rate |
|---|---|---|---|
| Population 16 years and over | 669,196 | 67.2% | 4.4% |
| 16 to 19 years | 37,608 | 37.6% | 13.1% |
| 20 to 24 years | 44,633 | 80.6% | 7.6% |
| 25 to 29 years | 55,936 | 84.9% | 4.7% |
| 30 to 34 years | 67,309 | 82.3% | 3.8% |
| 35 to 44 years | 128,069 | 83.3% | 4.0% |
| 45 to 54 years | 107,466 | 83.9% | 3.2% |
| 55 to 59 years | 52,610 | 78.4% | 3.2% |
| 60 to 64 years | 55,407 | 62.7% | 3.5% |
| 65 to 74 years | 75,971 | 28.1% | 3.7% |
| 75 years and over | 44,187 | 6.2% | 6.3% |
Race or Hispanic origin
| Demographic characteristic | Total | Labor force participation rate | Unemployment rate |
|---|---|---|---|
| White alone | 461,464 | 65.7% | 4.1% |
| Black or African American alone | 23,755 | 75.6% | 5.2% |
| American Indian and Alaska Native alone | 6,620 | 58.6% | 5.7% |
| Asian alone | 86,772 | 70.5% | 4.4% |
| Native Hawaiian and other Pacific Islander alone | 3,571 | 61.2% | 3.9% |
| Some other race alone | 29,319 | 71.9% | 3.4% |
| Two or more races | 57,695 | 70.0% | 6.0% |
| Hispanic or Latino origin (of any race) | 66,794 | 72.3% | 3.8% |
| White alone, not Hispanic or Latino | 446,503 | 65.4% | 4.2% |
| Population 20 to 64 years | 511,430 | 80.5% | 4.1% |
Sex
| Demographic characteristic | Total | Labor force participation rate | Unemployment rate |
|---|---|---|---|
| Male | 261,812 | 86.8% | 3.8% |
| Female | 249,618 | 73.8% | 4.4% |
Females with children
| Demographic characteristic | Total | Labor force participation rate | Unemployment rate |
|---|---|---|---|
| With own children under 18 | 91,780 | 69.8% | 4.1% |
| With own children under 6 only | 22,908 | 67.3% | 3.8% |
| With own children under 6 and 6 to 17 | 17,677 | 56.2% | 5.0% |
| With own children 6 to 17 only | 51,195 | 75.6% | 4.0% |
Poverty status in the past 12 months
| Demographic characteristic | Total | Labor force participation rate | Unemployment rate |
|---|---|---|---|
| Below poverty level | 36,198 | 42.0% | 23.1% |
| At or above the poverty level | 470,791 | 84.0% | 3.3% |
Disability status
| Demographic characteristic | Total | Labor force participation rate | Unemployment rate |
|---|---|---|---|
| With any disability | 50,188 | 54.8% | 8.3% |
Educational attainment
| Demographic characteristic | Total | Labor force participation rate | Unemployment rate |
|---|---|---|---|
| Population 25 to 64 years | 466,797 | 80.5% | 3.7% |
| Less than high school graduate | 32,222 | 66.2% | 3.8% |
| High school graduate (includes equivalency) | 103,156 | 75.1% | 5.2% |
| Some college or associate's degree | 153,429 | 79.9% | 3.8% |
| Bachelor's degree or higher | 177,990 | 86.6% | 3.0% |
Source: U.S. Census Bureau, American Community Survey 5-year estimates, S2301 | Employment Status
This workforce product was funded by a grant awarded by the U.S. Department of Labor's Employment and Training Administration. The product was created by the recipient and does not necessarily reflect the official position of the U.S. Department of Labor. The Department of Labor makes no guarantees, warranties, or assurances of any kind, expressed or implied, with respect to such information, including any information on linked sites and including, but not limited to, accuracy of the information or its completeness, timeliness, usefulness, adequacy, continued availability, or ownership. This product is copyrighted by the institution that created it. Internal use by an organization and/or personal use by an individual for non-commercial purposes is permissible. All other uses require the prior authorization of the copyright owner.