

Posted October 2025
August 2025 highlights
The unemployment rate in the county was 4.9% in August 2025, which remained the same as in July 2025 and unemployment rate decreased from 5.1% August 2024. Overall job trends show the Kennewick-Pasco-Richland metro area had total nonfarm employment of 128,500 jobs in August 2025, representing a 0.5% decrease with 700 jobs decreased from August 2024.
Summary
Agriculture, food manufacturing, health care, education and industrial sectors continue to play pivotal roles in Franklin County’s robust economy. The agricultural sector and particularly food manufacturing remains a cornerstone of local employment and economic stability. In 2024, the county reported approximately 37,595 jobs and an average annual unemployment rate of 5.7%. Health care and education are significant employment sectors, underpinning the local economy.
Health care and education remain significant employment anchors with 3,182 jobs, or 8.5% employment share, supporting both workforce stability and community development. Population growth has continued, with a diverse demographic, especially the Hispanic community and shaping economic and workforce strategies. This demographic has been instrumental in driving entrepreneurship, labor force participation and cultural enrichment.
Efforts to attract a broader range of industries and support small businesses have strengthened industrial diversity and economic resilience. Workforce development initiatives have emphasized skill enhancement in agriculture and manufacturing to maintain competitiveness and meet evolving industry demands.
Franklin County geographic overview
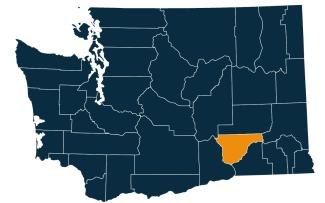
Franklin County is in the south-central part of Washington. It is part of the Tri-Cities metropolitan area, which includes Kennewick and Richland. The city of Pasco is the county seat and also the largest city in the county. Franklin County’s population was 96,749 in the 2020 census. In 2022, the Census estimated the population at 98,678, which is 2.0% growth from the 2020 census.
The county covers 1,265 square miles, including 23 square miles of water. It features a mix of agricultural land and rolling prairie-like terrain.
Franklin County was created out of Whitman County in 1883 and was named after Benjamin Franklin.
Washington has 12 regional Workforce Development Areas. Franklin County is part of Area 11, the Benton-Franklin Workforce Development Council. Visit the Workforce Training & Education Coordinating Board website for information about the workforce regions.
Franklin County employment situation for August 2025
Monthly labor force and unemployment
-
As of August 2025, Franklin County’s total labor force and employment increased, and unemployment decreased since August 2024.
-
Franklin County has more than 46,662 people in the labor force, with an increase of 1.7% or 758 workers from August 2024. The employed workforce increased by 1.9% or 832 workers and unemployed workers decreased by 3.1% or 74 workers. About 2,277 people were unemployed and looking for work.
-
The unemployment rate in the county was 4.9% in August 2025, which remained the same as in July 2025. The unemployment rate decreased from 5.1% in August 2024.
Unemployment rate, not seasonally adjusted
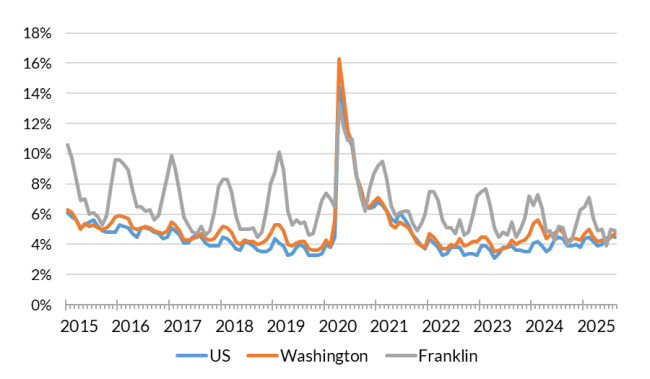
Source: Employment Security Department/Labor Market Information and Research Division, Local area unemployment statistics
Monthly nonfarm payroll employment Kennewick-Pasco-Richland MSA
-
Overall job trends show the Kennewick-Pasco-Richland metro area had total nonfarm employment of 128,500 jobs in August 2025, representing a 0.5% decrease with 700 jobs decrease from August 2024. The private sector expanded by 300 jobs (0.3%), while government employment declined by 1,000 jobs (5.3%).
-
Industries with notable growth include private education and health services, expanding by 700 jobs (3.4%). Construction industry added more than 500 new jobs or 4.3% over the year, followed by wholesale trade with 100 new jobs (2.7%) and other services cluster with 2.8% or 100 jobs growth.
-
Industries facing declines include manufacturing, which posted a drop of 600 jobs (6.1%). Financial activities contracted by 100 jobs (2.4%). Information industry decreased by 100 jobs (12.5%) Professional and business services recorded a decrease over the year of 300 jobs (1.3%) and leisure and hospitality decreased by 100 jobs or 0.8%.
-
Government employment totaled 18,000 jobs, reflecting a 5.3% decrease (1,000 jobs). Local government fell by 800 jobs (5.4%), state government employment declined by 300 jobs (10.0%) and federal government employment added 100 jobs (8.3%).
Nonfarm employment estimates, not seasonally adjusted, Kennewick-Pasco-Richland Metropolitan Statistical Area (Benton and Franklin Counties)
| NAICS Industry Title | Aug 2025 (Prelim) | Jul 2025 (Revised) | Aug 2024 (Revised) | Jul 2025 to Aug 2025 Change | Aug 2024 to Aug 2025 Change | Aug 2024 to Aug 2025 % Change |
|---|---|---|---|---|---|---|
| Total nonfarm | 128,500 | 129,300 | 129,200 | -800 | -700 | -0.5% |
| Total private (total nonfarm less government) | 110,500 | 110,800 | 110,200 | -300 | 300 | 0.3% |
| Goods-producing | 21,400 | 21,300 | 21,500 | 100 | -100 | -0.5% |
| - Mining, logging and construction | 12,200 | 12,100 | 11,700 | 100 | 500 | 4.3% |
| - Manufacturing | 9,200 | 9,200 | 9,800 | 0 | -600 | -6.1% |
| Service-providing | 107,100 | 108,000 | 107,700 | -900 | -600 | -0.6% |
| - Wholesale trade | 3,800 | 3,800 | 3,700 | 0 | 100 | 2.7% |
| - Retail trade | 13,700 | 13,800 | 14,000 | -100 | -300 | -2.1% |
| - Transportation, warehousing, and utilities | 4,900 | 4,900 | 4,900 | 0 | 0 | 0.0% |
| - Information | 700 | 700 | 800 | 0 | -100 | -12.5% |
| - Financial activities | 4,000 | 4,100 | 4,100 | -100 | -100 | -2.4% |
| - Professional and business services | 23,600 | 23,700 | 23,900 | -100 | -300 | -1.3% |
| - Private education and health services | 21,400 | 21,500 | 20,700 | -100 | 700 | 3.4% |
| - Leisure and hospitality | 12,800 | 12,800 | 12,900 | 0 | -100 | -0.8% |
| - Other services | 3,700 | 3,700 | 3,600 | 0 | 100 | 2.8% |
| - Government | 18,000 | 18,500 | 19,000 | -500 | -1,000 | -5.3% |
Note: Data benchmarked through March 2025, updated September 15, 2025.
Source: Employment Security Department/Labor Market Information and Research Division, Washington employment estimates (WA-QB & CES)
Detailed tables can be found on the source page in the third spreadsheet titled Current employment estimates, not seasonally adjusted.
Total covered employment in Franklin County
In 2024, Franklin County saw significant employment trends across various sectors. Wages paid totaled $2.15 billion, with an average annual employment of 37,595 people and an average annual wage of $57,233. Key sectors like agriculture, forestry, fishing and hunting employed 6,853 individuals with an average wage of $43,946.
The construction sector showed robust activity, with 2,671 employees earning an average of $66,478 annually. Manufacturing also played a crucial role, employing 4,705 people with an average wage of $59,831. Finance and insurance offered the highest sector-specific average wage at $90,103 for 396 employees. Government employment was substantial, with 6,983 employees earning an average of $72,731. Overall, the data indicates a diverse employment landscape with notable contributions from both traditional and service-oriented sectors.
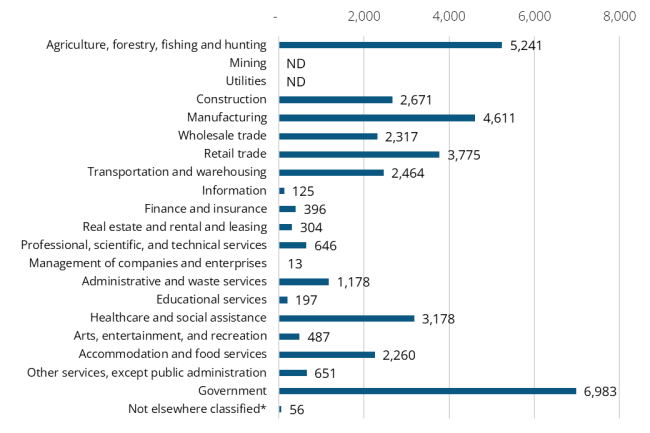
Employment by industry, Franklin County 2024 annual average
Source: Employment Security Department/Labor Market Information and Research Division, Covered Employment (QCEW)
Average annual covered employment in Franklin County was 37,554 in 2024. Covered employment refers to workers who received wages in Washington state and are eligible for state and federal unemployment insurance (UI) compensation programs.
Top five sectors in terms of employment in 2024:
-
Government (6,983 jobs or 18.6% employment share)
-
Agriculture (5,241 jobs or 14.0% employment share)
-
Manufacturing (4,611 jobs or 12.3% employment share)
-
Retail trade (3,775 jobs or 10.1% employment share)
-
Health care and social assistance were $612.6 million, (3,178 jobs or 8.5% employment share)
-
Construction (2,679 jobs or 7.1% employment share)
Wages can vary substantially from one industry sector to another. The average annual wage in Franklin County for all industries was $57,267 with total payroll of $2.15 billion in 2024.
The top five sectors in terms of wages in 2024 were:
-
Finance and insurance ($90,103)
-
Wholesale trade ($78,668)
-
Management of companies and enterprises ($75,515)
-
Government ($72,741)
-
Information ($66,469)
-
Construction ($66,372)
Workforce demographics in Franklin County
The labor force participation rate is highest among the 20 to 24 years age group at 83.1%, while the 65-74 age group has the lowest at 24.6%. The majority of the workforce is Hispanic or Latino origin with participation of 69.8%. White, not Hispanic or Latino had a participation rate of 63.2%.
Participation rate for labor force prime working population 20 to 64 years of age was 78.8%. Male workers have a slightly higher participation rate (84.1%) compared to female workers (72.9%). People with a bachelor’s degree or higher have the highest participation rate at 88.1%, while those with less than a high school diploma have the lowest at 71.8%.
Visit the U.S. Census Bureau website for quick facts about Franklin County.
Age
| Demographic characteristic | Total | Labor force participation rate | Unemployment rate |
|---|---|---|---|
| Population 16 years and over | 70,525 | 66.3% | 5.3% |
| 16 to 19 years | 6,560 | 37.1% | 21.9% |
| 20 to 24 years | 6,936 | 83.1% | 7.0% |
| 25 to 29 years | 6,761 | 79.7% | 3.6% |
| 30 to 34 years | 7,468 | 81.7% | 3.5% |
| 35 to 44 years | 13,709 | 80.5% | 5.0% |
| 45 to 54 years | 10,769 | 81.9% | 4.4% |
| 55 to 59 years | 4,392 | 74.9% | 1.9% |
| 60 to 64 years | 4,073 | 54.8% | 2.5% |
| 65 to 74 years | 6,382 | 24.6% | 5.8% |
| 75 years and over | 3,475 | 3.3% | 0.0% |
Race or Hispanic origin
| Demographic characteristic | Total | Labor force participation rate | Unemployment rate |
|---|---|---|---|
| White alone | 37,809 | 64.4% | 4.1% |
| Black or African American alone | 1,411 | 54.9% | 19.1% |
| American Indian and Alaska Native alone | 1,007 | 65.5% | 3.0% |
| Asian alone | 1,465 | 63.3% | 8.2% |
| Native Hawaiian and other Pacific Islander alone | 137 | 70.8% | 0.0% |
| Some other race alone | 15,256 | 71.1% | 5.1% |
| Two or more races | 13,440 | 67.6% | 7.7% |
| Hispanic or Latino origin (of any race) | 35,517 | 69.8% | 5.8% |
| White alone, not Hispanic or Latino | 29,515 | 63.2% | 4.0% |
| Population 20 to 64 years | 54,108 | 78.8% | 4.4% |
Sex
| Demographic characteristic | Total | Labor force participation rate | Unemployment rate |
|---|---|---|---|
| Male | 28,718 | 84.1% | 4.4% |
| Female | 25,390 | 72.9% | 4.4% |
Females with children
| Demographic characteristic | Total | Labor force participation rate | Unemployment rate |
|---|---|---|---|
| With own children under 18 | 11,806 | 73.8% | 2.1% |
| With own children under 6 only | 2,716 | 70.3% | 0.4% |
| With own children under 6 and 6 to 17 | 2,869 | 63.0% | 0.8% |
| With own children 6 to 17 only | 6,221 | 80.3% | 3.1% |
Poverty status in the past 12 months
| Demographic characteristic | Total | Labor force participation rate | Unemployment rate |
|---|---|---|---|
| Below poverty level | 5,825 | 49.0% | 17.3% |
| At or above the poverty level | 46,539 | 85.5% | 3.5% |
Disability status
| Demographic characteristic | Total | Labor force participation rate | Unemployment rate |
|---|---|---|---|
| With any disability | 5,441 | 59.2% | 17.7% |
Educational attainment
| Demographic characteristic | Total | Labor force participation rate | Unemployment rate |
|---|---|---|---|
| Population 25 to 64 years | 47,172 | 78.2% | 4.0% |
| Less than high school graduate | 11,462 | 71.8% | 7.5% |
| High school graduate (includes equivalency) | 12,519 | 75.6% | 4.7% |
| Some college or associate's degree | 13,541 | 78.8% | 2.8% |
| Bachelor's degree or higher | 9,650 | 88.1% | 1.2% |
Source: U.S. Census Bureau, American Community Survey 5-year estimates, S2301 | Employment Status
This workforce product was funded by a grant awarded by the U.S. Department of Labor's Employment and Training Administration. The product was created by the recipient and does not necessarily reflect the official position of the U.S. Department of Labor. The Department of Labor makes no guarantees, warranties, or assurances of any kind, expressed or implied, with respect to such information, including any information on linked sites and including, but not limited to, accuracy of the information or its completeness, timeliness, usefulness, adequacy, continued availability, or ownership. This product is copyrighted by the institution that created it. Internal use by an organization and/or personal use by an individual for non-commercial purposes is permissible. All other uses require the prior authorization of the copyright owner.