

- Posted October 2025
August 2025 highlights
In August, the not seasonally adjusted unemployment rate decreased from 4.9% to 4.6% over the year, and total nonfarm employment decreased by 0.1% over the year.
Summary
Over the past four years, Asotin County experienced notable shifts in employment and unemployment. In 2021, the unemployment rate was 3.7%, with 395 people actively seeking work. Resident employment increased by 3.8% from 2022 to 2024. From 2021 to 2022, there was a slightly smaller increase in employment with 0.4% growth, from 10,228 to 10,274 employees. As of August 2025, unemployment rate stands at 3.3%.
Service-providing sectors continued to dominate the job market in Asotin County in 2024, accounting for 84.2% of total employment. Within that group, the retail trade sector remained the standout performer over the past three years, adding 161 new jobs, a 15.5% increase. The largest contributors within retail trade were food and beverage stores, which added 113 jobs. The health care and social assistance sector also showed steady growth, averaging a 3.4% annual increase, and adding 53 new jobs over the same period. Meanwhile, goods-producing industries comprised 15.8% of total employment. Overall, the labor market in Asotin County demonstrated continued resilience and adaptability, mirroring broader economic trends and reflecting the strength of local industry dynamics.
Location
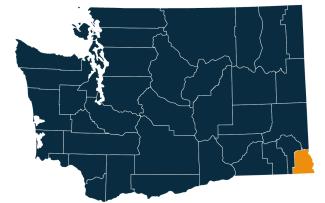
Asotin County is in the southeastern corner of Washington. It is part of the Lewiston–Clarkston metropolitan area, which includes Nez Perce County, Idaho. The town of Asotin is the county seat. Clarkston is the largest city in the county. Asotin County’s population was 22,285 in the 2020 census. In 2023, Census estimated the population at 22,549, which is 1.2% growth from the 2020 census.
The county covers 641 square miles, including 4.4 square miles of water. It features a mix of fertile agricultural regions and rugged terrain marked by creeks and gullies.
Asotin County was created out of Garfield County in 1883 and derives its name from a Nez Perce word meaning "Eel Creek."
Washington has 12 regional Workforce Development Areas. Asotin County is part of Area 10, the Eastern Washington Partnership. Visit the Workforce Training & Education Coordinating Board website for information about the workforce regions.
Asotin County employment situation for August 2025
Monthly labor force and unemployment
-
As of August 2025, Asotin County total labor force decreased and employment increased, while unemployment decreased since August 2024.
-
Asotin County has over 9,710 people in the labor force, with a decrease of 0.4% or 40 workers from August 2024 and employed workforce increased by 0.1% or 5 workers. Unemployed workers decreased by 12.2% or 45 workers. About 324 people were unemployed and looking for work.
-
The unemployment rate in the county was 3.3% in August 2025, which remained the same as in July 2025 and unemployment rate decreased from 3.8% in August 2024.
Unemployment rate, not seasonally adjusted
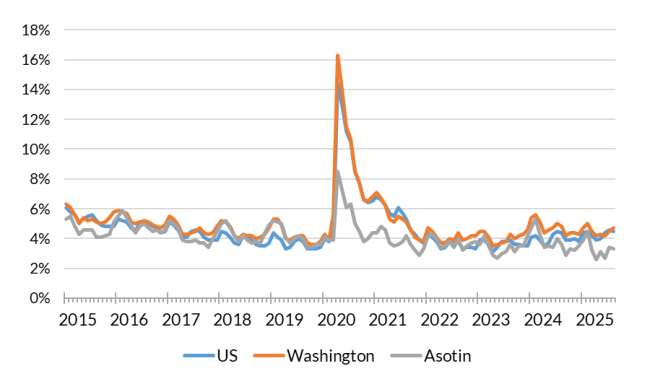
Source: Employment Security Department/Labor Market Information and Research Division, Local area unemployment statistics
Monthly payroll employment in Asotin County
-
Overall job trends show that Asotin County had total nonfarm employment of 7,210 jobs, reflecting a 1.4% increase, with 100 jobs gain compared to August 2024. The private sector expanded by 120 jobs (2.0%), while government employment decreased by 0.8%, a decline of 10 jobs.
-
Industries with growth include private education and health services, which increased by 7.9%, adding 140 jobs. The construction industry added 30 jobs or 5.9%, followed by manufacturing with 20 jobs or 4.3% growth. The retail trade industry added about 20 jobs or 1.9% over the year, followed by financial activities with 10 jobs (4.2%). The transportation, warehousing, and utilities with 10 jobs or 10.0% growth
-
Industries facing declines include professional and business industry which lost 30 jobs or 6.4%, followed by leisure and hospitalist loss of 50 jobs or 5.7%. The other services industry cluster, which saw a drop of 5.9%, lost 10 jobs.
-
Government employment trends reflect continued shifts declining by 10 jobs or 0.8%, with federal positions holding steady, while state government increased by 20.0%, adding 20 positions. Federal government decreased by 30 jobs or 2.8%.
Nonfarm employment estimates, not seasonally adjusted, Asotin County
| NAICS Industry Title | Aug 2025 (Prelim) | Jul 2025 (Revised) | Aug 2024 (Revised) | Jul 2025 to Aug 2025 Change | Aug 2024 to Aug 2025 Change | Aug 2024 to Aug 2025 % Change |
|---|---|---|---|---|---|---|
| Total nonfarm | 7,210 | 7,130 | 7,110 | 80 | 100 | 1.4% |
| Total private (total nonfarm less government) | 5,980 | 5,910 | 5,860 | 70 | 120 | 2.0% |
| Goods-producing | 1,020 | 1,000 | 980 | 20 | 40 | 4.1% |
| - Mining, logging and construction | 540 | 520 | 510 | 20 | 30 | 5.9% |
| - Manufacturing | 480 | 480 | 460 | 0 | 20 | 4.3% |
| Service-providing | 6,190 | 6,130 | 6,130 | 60 | 60 | 1.0% |
| - Wholesale trade | 110 | 110 | 110 | 0 | 0 | 0.0% |
| - Retail trade | 1,100 | 1,090 | 1,080 | 10 | 20 | 1.9% |
| - Transportation, warehousing, and utilities | 110 | 100 | 100 | 10 | 10 | 10.0% |
| - Information | 60 | 60 | 60 | 0 | 0 | 0.0% |
| - Financial activities | 250 | 250 | 240 | 0 | 10 | 4.2% |
| - Professional and business services | 440 | 440 | 470 | 0 | -30 | -6.4% |
| - Private education and health services | 1,910 | 1,880 | 1,770 | 30 | 140 | 7.9% |
| - Leisure and hospitality | 830 | 810 | 880 | 20 | -50 | -5.7% |
| - Other services | 160 | 160 | 170 | 0 | -10 | -5.9% |
| - Government | 1,230 | 1,230 | 1,240 | 0 | -10 | -0.8% |
Note: Data benchmarked through March 2025, updated September 15, 2025.
Source: Employment Security Department/Labor Market Information and Research Division, Washington employment estimates (WA-QB & CES)
Detailed tables can be found on the source page in the third spreadsheet titled Current employment estimates, not seasonally adjusted.
Total covered employment in Asotin County
In 2024, Asotin County’s wages totaled $371.4 million. Average annual covered employment was 6,824 and the average annual wage was $54,469. Covered employment refers to workers who received wages in Washington state and are eligible for state and federal unemployment insurance (UI) compensation programs.
The health care and social assistance sector led in employment with 1,496 jobs, averaging $57,859 annually. Construction (508 jobs), and finance and insurance (197 jobs) sectors showed strong wages at $75,101 and $83,978, respectively. Wholesale trade (114 jobs) and information (55 jobs) sectors had high average wages of $110,194 and $95,2641, though lower employment numbers.
Retail trade had significant employment at 1,089 but lower wages at $42,243. Agriculture and accommodation and food services sectors had lower average wages, reflecting the diverse economic landscape. The service-providing sector continued to dominate, making up a significant portion of the total employment. Key industries experienced growth, such as retail trade, health care, and social assistance, contributing to the overall employment increase.
Employment by industry, Asotin County 2024 annual average
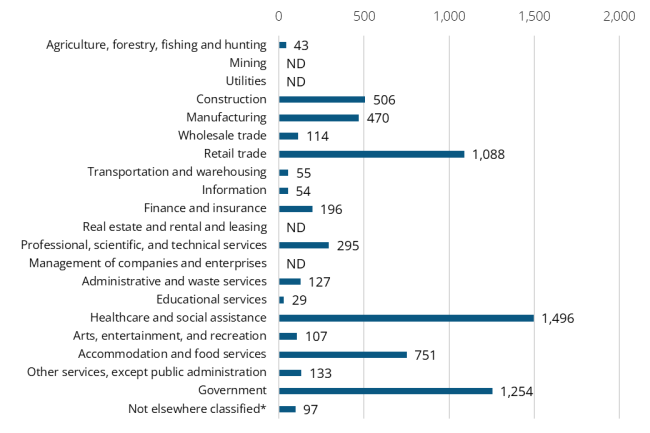
Source: Employment Security Department/Labor Market Information and Research Division, Covered Employment (QCEW)
Note: ND stands for not disclosed. ND is used to avoid disclosing data for individual employers. Industries labeled ND are grouped in the Not elsewhere classified category.
The top six sectors in terms of employment in 2024:
-
Health care and social assistance (1,496 or 21.9%)
-
Government (1,253 or 18.4%)
-
Retail trade (1,089 or 16.0%)
-
Accommodation and food services (751 or 11.0%)
-
Construction (508 or 7.4%)
-
Manufacturing (470 or 6.9%)
Wages can vary substantially from one sector to another.
The top eight sectors in terms of wages in 2024:
-
Wholesale trade ($110,194)
-
Information ($95,264)
-
Professional, scientific, and technical services ($84,526)
-
Finance and insurance ($83,978)
-
Construction ($75,101)
-
Transportation and warehousing ($63,850)
-
Health care and social assistance ($57,859)
-
Government ($55,891)
Workforce demographics in Asotin County
The labor force participation rate is highest among the 20-24 age group at 92%. The 65-74 age group has the lowest at 19.8%. Most of the workforce is white with a 55.0% labor force participation rate. Asian workers have the highest labor force participation rate at 83.6%.
Male workers have a slightly higher participation rate (76.3%) compared to female workers (75.2%). People with a bachelor’s degree or higher have the highest participation rate at 88.6%. People with less than a high school diploma have the lowest at 43.3%.
Visit the U.S. Census Bureau website for quick facts about Asotin County.
Age
| Demographic characteristic | Total | Labor force participation rate | Unemployment rate |
|---|---|---|---|
| Population 16 years and over | 18,573 | 56.0% | 5.8% |
| 16 to 19 years | 992 | 50.8% | 14.5% |
| 20 to 24 years | 1,188 | 92.0% | 7.4% |
| 25 to 29 years | 1,257 | 88.1% | 3.7% |
| 30 to 34 years | 1,261 | 68.6% | 3.1% |
| 35 to 44 years | 2,492 | 78.1% | 6.5% |
| 45 to 54 years | 2,549 | 79.6% | 8.1% |
| 55 to 59 years | 1,469 | 77.5% | 0.4% |
| 60 to 64 years | 1,846 | 51.9% | 8.0% |
| 65 to 74 years | 3,132 | 19.8% | 0.0% |
| 75 years and over | 2,387 | 6.0% | 3.5% |
Race and Hispanic or Latino origin
| Demographic characteristic | Total | Labor force participation rate | Unemployment rate |
|---|---|---|---|
| White alone | 16,732 | 55.0% | 6.4% |
| Black or African American alone | 107 | 60.7% | 0.0% |
| American Indian and Alaska Native alone | 201 | 38.8% | 0.0% |
| Asian alone | 134 | 83.6% | 0.0% |
| Native Hawaiian and other Pacific Islander alone | 0 | 0.0% | 0.0% |
| Some other race alone | 381 | 64.6% | 0.0% |
| Two or more races | 1,018 | 69.6% | 1.4% |
| Hispanic or Latino origin (of any race) | 704 | 74.1% | 9.8% |
| White alone, not Hispanic or Latino | 16,454 | 54.5% | 6.1% |
| Population 20 to 64 years | 12,062 | 75.8% | 5.7% |
Sex
| Demographic characteristic | Total | Labor force participation rate | Unemployment rate |
|---|---|---|---|
| Male | 5,974 | 76.3% | 5.9% |
| Female | 6,088 | 75.2% | 5.5% |
Females with children
| Demographic characteristic | Total | Labor force participation rate | Unemployment rate |
|---|---|---|---|
| With own children under 18 | 1,720 | 76.7% | 6.4% |
| With own children under 6 only | 311 | 74.6% | 3.0% |
| With own children under 6 and 6 to 17 | 293 | 70.0% | 4.4% |
| With own children 6 to 17 only | 1,116 | 79.1% | 7.7% |
Poverty status in the past 12 months
| Demographic characteristic | Total | Labor force participation rate | Unemployment rate |
|---|---|---|---|
| Below poverty level | 1,762 | 43.2% | 22.6% |
| At or above the poverty level | 10,239 | 81.8% | 4.2% |
Disability status
| Demographic characteristic | Total | Labor force participation rate | Unemployment rate |
|---|---|---|---|
| With any disability | 2,083 | 39.4% | 11.1% |
Educational attainment
| Demographic characteristic | Total | Labor force participation rate | Unemployment rate |
|---|---|---|---|
| Population 25 to 64 years | 10,874 | 74.0% | 5.5% |
| Less than high school graduate | 786 | 43.4% | 0.0% |
| High school graduate (includes equivalency) | 3,456 | 65.2% | 5.7% |
| Some college or associate's degree | 4,147 | 78.3% | 6.3% |
| Bachelor's degree or higher | 2,485 | 88.6% | 4.9% |
Source: U.S. Census Bureau, American Community Survey 5-year estimates, S2301 | Employment Status
This workforce product was funded by a grant awarded by the U.S. Department of Labor's Employment and Training Administration. The product was created by the recipient and does not necessarily reflect the official position of the U.S. Department of Labor. The Department of Labor makes no guarantees, warranties, or assurances of any kind, expressed or implied, with respect to such information, including any information on linked sites and including, but not limited to, accuracy of the information or its completeness, timeliness, usefulness, adequacy, continued availability, or ownership. This product is copyrighted by the institution that created it. Internal use by an organization and/or personal use by an individual for non-commercial purposes is permissible. All other uses require the prior authorization of the copyright owner.