

Posted October 2025
August 2025 highlights
From July to August, the not seasonally adjusted unemployment rate increased from 5.5% to 5.7% and total nonfarm employment increased by 80 jobs.
Summary
True to its name, Pacific County is known for its scenery and its coastal location. Seafood production, particularly shellfish, is a major industry. Tourism is also a major sector in seaside towns such as Long Beach. Employment peaks during the summer months in accommodation and food services, retail trade, and arts, entertainment and recreation.
Pacific County was hit hard by the Covid-19 pandemic, with unemployment peaking at 19.5% in April 2020. Tourism was slow to recover, and employment in Pacific County still experiences high seasonality compared to the rest of the state. Total nonfarm employment was back to pre-pandemic levels as of 2022, but growth has been slow since then.
Location
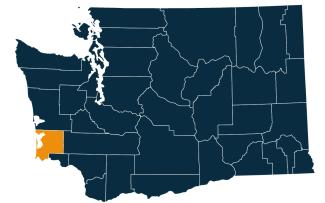
Pacific County is located in western Washington, along the Pacific Ocean. Neighboring counties are Grays Harbor to the north, Lewis to the east, and Wahkiakum to the south. Its two main geographic features are Willapa Bay, a major source of oyster production, and the mouth of the Columbia River along the county’s southern border. The Astoria-Megler Bridge connects Pacific County to nearby Clatsop County, Oregon.
Pacific County is part of the Pacific Mountain Workforce Development Area. Visit the Workforce Training & Education Coordinating Board website for information about the 12 workforce regions.
Employment situation for August 2025
Labor force and unemployment
-
The not seasonally adjusted unemployment rate was 5.7% in August 2025, up from 5.5% in the previous month and down from 6.3% in August 2024.
-
The total civilian labor force was 8,111 in August 2025, up from 7,979 in August 2024.
-
There were 464 unemployed persons in August 2025, 40 fewer than in August 2024.
Unemployment rate, not seasonally adjusted
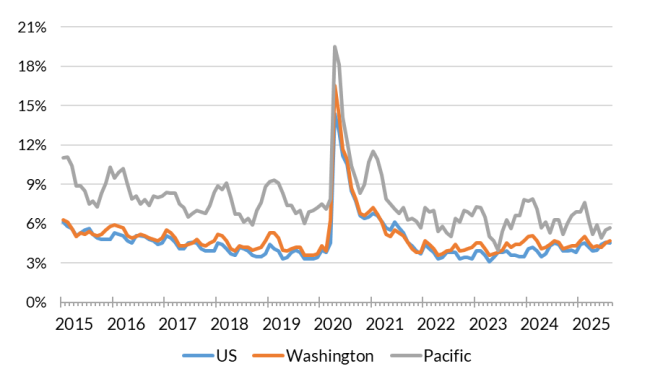
Source: Employment Security Department/Labor Market Information and Research Division, Local area unemployment statistics
Payroll employment
-
Total nonfarm employment was 6,580 in August 2025, not seasonally adjusted. This was up by 80 jobs from the previous month and up by 90 jobs (1.4%) from August 2024.
-
Over the course of 12 months, ending in August 2025, goods producing industries added 60 jobs (5.2%) and service providing industries added 20 jobs (0.4%).
-
The largest increases over the year were in manufacturing (up 50 jobs) and government (up 50 jobs).
-
The largest decrease over the year was in retail trade, which lost 40 jobs.
Nonfarm employment estimates, not seasonally adjusted, Pacific County
| NAICS Industry Title | Aug 2025 (Prelim) | Jul 2025 (Revised) | Aug 2024 (Revised) | Jul 2025 to Aug 2025 Change | Aug 2024 to Aug 2025 Change | Aug 2024 to Aug 2025 % Change |
|---|---|---|---|---|---|---|
| Total nonfarm | 6,580 | 6,500 | 6,490 | 80 | 90 | 1.4% |
| Total private (total nonfarm less government) | 4,630 | 4,590 | 4,590 | 40 | 40 | 0.9% |
| Goods-producing | 1,210 | 1,180 | 1,150 | 30 | 60 | 5.2% |
| - Mining and logging | 150 | 150 | 140 | 0 | 10 | 7.1% |
| - Construction | 290 | 290 | 300 | 0 | -10 | -3.3% |
| - Manufacturing | 770 | 740 | 720 | 30 | 50 | 6.9% |
| Service-providing | 5,360 | 5,330 | 5,340 | 30 | 20 | 0.4% |
| - Wholesale trade | 30 | 30 | 30 | 0 | 0 | 0.0% |
| - Retail trade | 690 | 700 | 730 | -10 | -40 | -5.5% |
| - Transportation, warehousing, and utilities | 60 | 60 | 60 | 0 | 0 | 0.0% |
| - Information | 40 | 40 | 40 | 0 | 0 | 0.0% |
| - Financial activities | 260 | 260 | 260 | 0 | 0 | 0.0% |
| - Professional and business services | 420 | 410 | 400 | 10 | 20 | 5.0% |
| - Private education and health services | 650 | 650 | 640 | 0 | 10 | 1.6% |
| - Leisure and hospitality | 1,090 | 1,090 | 1,110 | 0 | -20 | -1.8% |
| - Other services | 180 | 170 | 180 | 10 | 0 | 0.0% |
| - Government | 1,950 | 1,920 | 1,900 | 30 | 50 | 2.6% |
Note: Data benchmarked through March 2025, updated September 15, 2025.
Source: Employment Security Department/Labor Market Information and Research Division, Washington employment estimates (WA-QB & CES)
Detailed tables can be found on the source page in the third spreadsheet titled Current employment estimates, not seasonally adjusted.
Industry employment (covered employment)
Employment by industry, Pacific County 2024 annual average
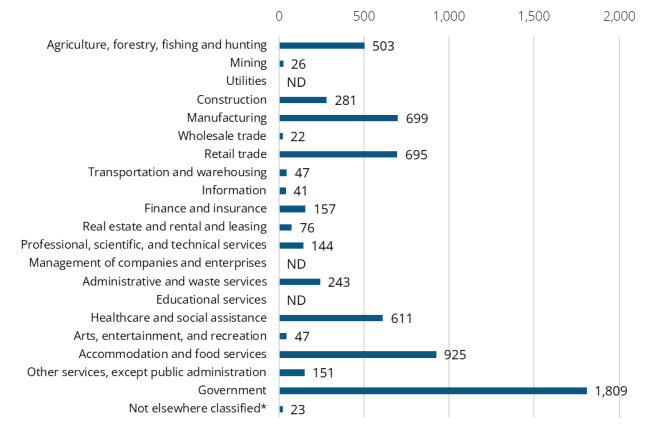
Source: Employment Security Department/Labor Market Information and Research Division, Covered Employment (QCEW)
Average annual covered employment in Pacific County was 6,498 in 2024. This was little changed from 6,555 in 2023. Covered employment refers to workers who received wages in Washington state and are eligible for state and federal unemployment insurance (UI) compensation programs.
Pacific County is a major producer of seafood, and manufacturing is the third largest industry. Tourism is also a major industry, with accommodation and food services and retail trade making up a combined 1620 jobs, or 25% of all employment.
Top five sectors in terms of employment in 2024:
-
Government (1,809)
-
Accommodation and food services (925)
-
Manufacturing (699)
-
Retail trade (695)
-
Health care and social assistance (611)
The average annual wage in Pacific County was $50,311 in 2024. This was up from $47,089 in 2023, a 6.8% increase. Pacific County had the third lowest average annual wage out of Washington’s 39 counties in 2024.
Top five sectors in terms of wages in 2024:
-
Professional, scientific and technical services ($73,161)
-
Finance and insurance ($71,460)
-
Government ($69,753)
-
Wholesale trade ($61,669)
-
Manufacturing ($53,675)
Workforce demographics for Pacific County
Pacific County’s 16 and over population is 20,570. There is a large 55 and over population, leading to a low labor force participation rate of 47.8%. Among those aged 20 to 64, men tended to have higher labor force participation (76.1% vs. 66.8%) and higher unemployment (6.8% vs. 3.8%) than women.
Visit the U.S. Census Bureau website for quick facts about Pacific County.
Age
| Demographic characteristic | Total | Labor force participation rate | Unemployment rate |
|---|---|---|---|
| Population 16 years and over | 20,570 | 47.8% | 4.8% |
| 16 to 19 years | 963 | 43.3% | 4.6% |
| 20 to 24 years | 777 | 85.5% | 11.6% |
| 25 to 29 years | 885 | 93.0% | 1.6% |
| 30 to 34 years | 1,030 | 77.7% | 1.8% |
| 35 to 44 years | 2,497 | 84.1% | 7.4% |
| 45 to 54 years | 2,569 | 73.4% | 4.9% |
| 55 to 59 years | 1,823 | 68.2% | 7.7% |
| 60 to 64 years | 2,191 | 40.8% | 0.6% |
| 65 to 74 years | 5,150 | 16.7% | 0.0% |
| 75 years and over | 2,685 | 5.5% | 0.0% |
Race or Hispanic origin
| Demographic characteristic | Total | Labor force participation rate | Unemployment rate |
|---|---|---|---|
| White alone | 17,576 | 47.2% | 5.0% |
| Black or African American alone | 138 | 18.8% | 11.5% |
| American Indian and Alaska Native alone | 334 | 62.3% | 9.7% |
| Asian alone | 389 | 58.9% | 0.0% |
| Native Hawaiian and other Pacific Islander alone | 3 | 0.0% | - |
| Some other race alone | 932 | 60.5% | 3.8% |
| Two or more races | 1,198 | 42.0% | 2.8% |
| Hispanic or Latino origin (of any race) | 1,620 | 62.3% | 3.6% |
| White alone, not Hispanic or Latino | 17,032 | 46.8% | 5.0% |
| Population 20 to 64 years | 11,772 | 71.4% | 5.4% |
Sex
| Demographic characteristic | Total | Labor force participation rate | Unemployment rate |
|---|---|---|---|
| Male | 5,892 | 76.1% | 6.8% |
| Female | 5,880 | 66.8% | 3.8% |
Females with children
| Demographic characteristic | Total | Labor force participation rate | Unemployment rate |
|---|---|---|---|
| With own children under 18 | 1,798 | 83.5% | 0.0% |
| With own children under 6 only | 375 | 87.7% | 0.0% |
| With own children under 6 and 6 to 17 | 464 | 62.5% | 0.0% |
| With own children 6 to 17 only | 959 | 92.0% | 0.0% |
Poverty status in the past 12 months
| Demographic characteristic | Total | Labor force participation rate | Unemployment rate |
|---|---|---|---|
| Below poverty level | 1,683 | 34.4% | 11.4% |
| At or above the poverty level | 10,025 | 77.9% | 4.9% |
Disability status
| Demographic characteristic | Total | Labor force participation rate | Unemployment rate |
|---|---|---|---|
| With any disability | 2,058 | 40.3% | 15.9% |
Educational attainment
| Demographic characteristic | Total | Labor force participation rate | Unemployment rate |
|---|---|---|---|
| Population 25 to 64 years | 10,995 | 70.4% | 4.8% |
| Less than high school graduate | 1,240 | 52.5% | 5.2% |
| High school graduate (includes equivalency) | 3,340 | 73.0% | 7.5% |
| Some college or associate's degree | 4,317 | 71.6% | 2.3% |
| Bachelor's degree or higher | 2,098 | 74.5% | 5.4% |
Source: U.S. Census Bureau, American Community Survey 5-year estimates, S2301 | Employment Status.
This workforce product was funded by a grant awarded by the U.S. Department of Labor's Employment and Training Administration. The product was created by the recipient and does not necessarily reflect the official position of the U.S. Department of Labor. The Department of Labor makes no guarantees, warranties, or assurances of any kind, expressed or implied, with respect to such information, including any information on linked sites and including, but not limited to, accuracy of the information or its completeness, timeliness, usefulness, adequacy, continued availability, or ownership. This product is copyrighted by the institution that created it. Internal use by an organization and/or personal use by an individual for non-commercial purposes is permissible. All other uses require the prior authorization of the copyright owner.