

Posted October 2025
August 2025 highlights
In August, the not seasonally adjusted monthly unemployment rate decreased from 5.6% to 4.1%. Total nonfarm employment increased by 80 jobs in Adams County from August 2024 to August 2025.
Summary
Agriculture is an important industry in the Adams County economy. The county, as of the 2022 Agriculture Census, has 558 agriculture operations using 981,670 acres of land and generates $562 million in crop and livestock sales revenue. The labor force has 9,867 workers with an unemployment rate of 4.1% in August 2025. The preliminary total nonfarm employment during August 2025 was 6,810 jobs. Of the nonfarm jobs, 140 were gained in the government sector over the year, with 100 of the jobs added in state government.
Agriculture, forestry and fishing make up the largest industry sector in total covered employment with an annual average employment of 2,852 out of 9,437 total annual average employment in 2024. The county has 676 establishments employing workers covered by the Washington State Employment Security Act. The population of 16 and older in Adams County was 14,194 during 2023.
Geography
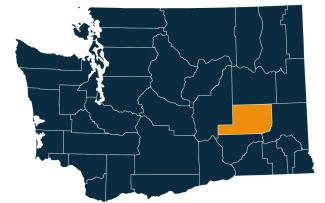
Adams County is located in eastern Washington. It is part of the SkillSource Workforce Development Area, which covers much of north and central Washington. Visit the Workforce Training & Education Coordinating Board website for information about Washington’s 12 workforce areas.
Employment situation for August 2025
Labor force and unemployment
- The not seasonally adjusted unemployment rate was 4.1% during August 2025, down from 4.4% in August 2024.
- The labor force increased by 165 workers from August 2024 to August 2025.
- The total employed workers increased by 182 workers from August 2024 to August 2025.
Unemployment rate, not seasonally adjusted
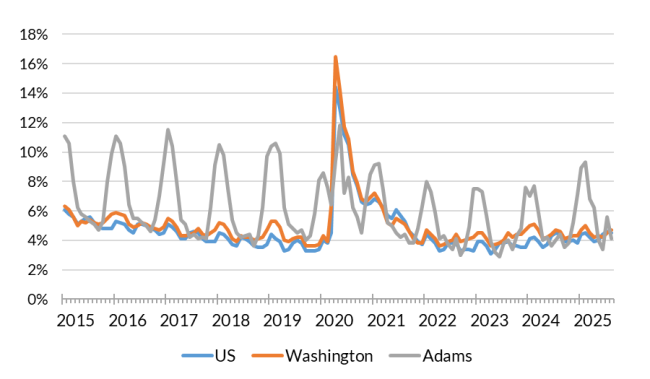
Source: Employment Security Department/Labor Market Information and Research Division, Local area unemployment statistics
Payroll employment, Current Employment Statistics
- Preliminary total nonfarm employment during August 2025 was 6,810, with an increase of 80 jobs from August 2024 and a decrease of 10 jobs from July 2025.
- Service-providing sectors accounted for 70 of the year-over-year jobs gains in Adams County.
- Healthcare and social assistance gained 20 jobs from August 2024 to August 2025.
- Leisure and hospitality decreased by 40 jobs from August 2024 to August 2025.
- The government sector gained 140 jobs from August 2024 to August 2025 but decreased by 90 jobs from July 2025. Federal and state government remained flat, but local government decreased by 90 jobs from July 2025.
Nonfarm employment estimates, not seasonally adjusted, Adams County
| NAICS Industry Title | Aug 2025 (Prelim) | Jul 2025 (Revised) | Aug 2024 (Revised) | Jul 2025 to Aug 2025 Change | Aug 2024 to Aug 2025 Change | Aug 2024 to Aug 2025 % Change |
|---|---|---|---|---|---|---|
| Total nonfarm | 6,810 | 6,820 | 6,730 | -10 | 80 | 1.2% |
| Total private (total nonfarm less government) | 4,900 | 4,830 | 4,960 | 70 | -60 | -1.2% |
| Goods-producing | 1,380 | 1,400 | 1,370 | -20 | 10 | 0.7% |
| - Mining, logging and construction | 120 | 130 | 120 | -10 | 0 | 0.0% |
| - Manufacturing | 1,260 | 1,270 | 1,240 | -10 | 20 | 1.6% |
| Service-providing | 5,430 | 5,420 | 5,360 | 10 | 70 | 1.3% |
| - Wholesale trade | 420 | 410 | 420 | 10 | 0 | 0.0% |
| - Retail trade | 700 | 660 | 730 | 40 | -30 | -4.1% |
| - Transportation, warehousing, and utilities | 560 | 550 | 580 | 10 | -20 | -3.4% |
| - Information | 10 | 10 | 10 | 0 | 0 | 0.0% |
| - Financial activities | 130 | 130 | 140 | 0 | -10 | -7.1% |
| - Professional and business services | 140 | 140 | 150 | 0 | -10 | -6.7% |
| - Private education and health services | 890 | 880 | 860 | 10 | 30 | 3.5% |
| - Leisure and hospitality | 540 | 510 | 580 | 30 | -40 | -6.9% |
| - Other services | 130 | 130 | 130 | 0 | 0 | 0.0% |
| - Government | 1,910 | 2,000 | 1,770 | -90 | 140 | 7.9% |
Note: Data benchmarked through March 2025, updated September15, 2025.
Source: Employment Security Department/Labor Market Information and Research Division, Washington employment estimates (WA-QB & CES)
Detailed tables can be found on the source page in the third spreadsheet titled Current employment estimates, not seasonally adjusted.
Industry sectors, covered employment
Employment by industry, Adams County 2024 annual average
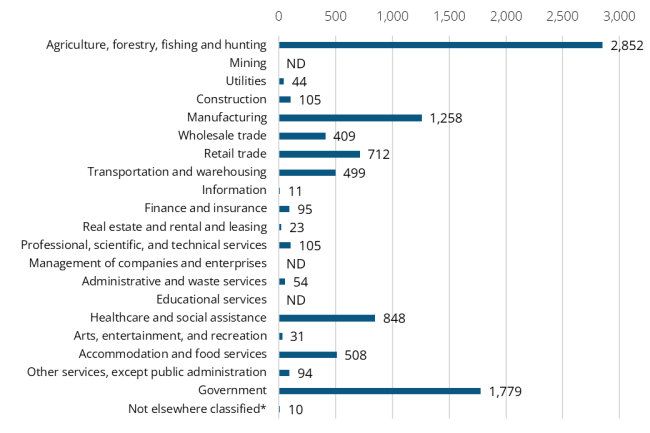
Source: Employment Security Department/Labor Market Information and Research Division, Covered Employment (QCEW)
Note: ND stands for not disclosed. ND is used to avoid disclosing data for individual employers. Industries labeled ND are grouped in the Not elsewhere classified category.
Average annual covered employment during 2024 in Adams County was 9,437. The average annual wage was $52,288. Covered employment refers to workers who received wages in Washington state and are eligible for state and federal unemployment insurance (UI) compensation programs.
Top sectors in terms of employment in 2024:
- Agriculture, forestry and fishing (2,852)
- Government (1,779)
- Manufacturing (1,258)
- Healthcare and social assistance (848)
- Retail trade (712)
Workforce demographics in Adams County
The population of 16 and over in Adams County was 14,194 during 2023. The labor force participation rate in Adams County for people 16 years and older was 61.5% with an unemployment rate of 4.1%. A reduced cohort, ages 20 to 64, show a 76.2% participation rate and a 3.7% unemployment rate. Within that group, 1,725 are below the poverty level.
Visit the U.S. Census Bureau website for quick facts about Adams County.
Age
| Demographic characteristic | Total | Labor force participation rate | Unemployment rate |
|---|---|---|---|
| Population 16 years and over | 14,194 | 61.5% | 4.1% |
| 16 to 19 years | 1,462 | 31.0% | 13.7% |
| 20 to 24 years | 1,400 | 74.6% | 8.6% |
| 25 to 29 years | 1,256 | 67.2% | 1.9% |
| 30 to 34 years | 1,265 | 78.5% | 1.7% |
| 35 to 44 years | 2,407 | 80.6% | 2.1% |
| 45 to 54 years | 2,003 | 83.2% | 3.4% |
| 55 to 59 years | 1,004 | 79.5% | 0.0% |
| 60 to 64 years | 951 | 57.7% | 11.8% |
| 65 to 74 years | 1,602 | 25.0% | 1.5% |
| 75 years and over | 844 | 5.5% | 0.0% |
Race or Hispanic origin
| Demographic characteristic | Total | Labor force participation rate | Unemployment rate |
|---|---|---|---|
| White alone | 7,161 | 55.4% | 6.4% |
| Black or African American alone | 77 | 51.9% | 0.0% |
| American Indian and Alaska Native alone | 460 | 85.4% | 0.0% |
| Asian alone | 129 | 69.8% | 0.0% |
| Native Hawaiian and other Pacific Islander alone | 56 | 92.9% | 0.0% |
| Some other race alone | 3,970 | 65.4% | 2.3% |
| Two or more races | 2,341 | 68.3% | 2.6% |
| Hispanic or Latino origin (of any race) | 8,186 | 67.8% | 3.1% |
| White alone, not Hispanic or Latino | 5,415 | 52.2% | 6.2% |
| Population 20 to 64 years | 10,286 | 76.2% | 3.7% |
Sex
| Demographic characteristic | Total | Labor force participation rate | Unemployment rate |
|---|---|---|---|
| Male | 5,328 | 82.8% | 3.2% |
| Female | 4,958 | 69.1% | 4.2% |
Females with children
| Demographic characteristic | Total | Labor force participation rate | Unemployment rate |
|---|---|---|---|
| With own children under 18 | 2,247 | 67.4% | 0.4% |
| With own children under 6 only | 314 | 56.4% | 0.6% |
| With own children under 6 and 6 to 17 | 773 | 56.8% | 0.0% |
| With own children 6 to 17 only | 1,160 | 77.5% | 0.6% |
Poverty status in the past 12 months
| Demographic characteristic | Total | Labor force participation rate | Unemployment rate |
|---|---|---|---|
| Below poverty level | 1,725 | 53.8% | 7.4% |
| At or above the poverty level | 8,500 | 81.3% | 3.1% |
Disability status
| Demographic characteristic | Total | Labor force participation rate | Unemployment rate |
|---|---|---|---|
| With any disability | 1,058 | 36.8% | 16.5% |
Educational attainment
| Demographic characteristic | Total | Labor force participation rate | Unemployment rate |
|---|---|---|---|
| Population 25 to 64 years | 8,886 | 76.4% | 2.9% |
| Less than high school graduate | 2,891 | 71.1% | 0.7% |
| High school graduate (includes equivalency) | 2,652 | 74.1% | 6.9% |
| Some college or associate's degree | 2,028 | 78.3% | 2.3% |
| Bachelor's degree or higher | 1,315 | 89.9% | 0.8% |
Source: U.S. Census Bureau, American Community Survey 5-year estimates, S2301 | Employment Status
This workforce product was funded by a grant awarded by the U.S. Department of Labor's Employment and Training Administration. The product was created by the recipient and does not necessarily reflect the official position of the U.S. Department of Labor. The Department of Labor makes no guarantees, warranties, or assurances of any kind, expressed or implied, with respect to such information, including any information on linked sites and including, but not limited to, accuracy of the information or its completeness, timeliness, usefulness, adequacy, continued availability, or ownership. This product is copyrighted by the institution that created it. Internal use by an organization and/or personal use by an individual for non-commercial purposes is permissible. All other uses require the prior authorization of the copyright owner.