

Posted October 2025
August 2025 highlights
In August, the not seasonally adjusted unemployment rate increased to 5.0% from 4.9% in July and total nonfarm employment declined by 1,500 from July 2025 to August 2025.
Summary
Pierce County is the second most populous county in the state based on the 2020 census. Tacoma is the county seat and largest city. Pierce County’s economy is supported by various industries, including aerospace, health care, logistics and technology. Its government sector is bolstered by Joint Base Lewis-McChord which is the sector’s largest employer. Pierce County is also home to the Port of Tacoma, the sixth busiest container port in North America and one of the 25 busiest in the world.
The county is a regional component of the Puget Sound economy. Its proximity to King County gives Pierce County residents access to the labor market in both counties. Today, 25% to 30% of workers residing in Pierce County commute to King County for work.
Location
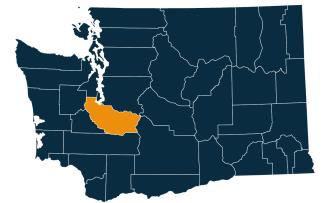
Pierce County is located at the southern basin of Puget Sound, and shares contiguous boundaries with six counties: King, Thurston, Kitsap, Mason, Lewis, and Yakima. Formed out of Thurston County in 1852 by the legislature of the Oregon territory, it was named for U.S. President Franklin Pierce. The county is a mix of old and newly incorporated cities, growing unincorporated areas, large-scale federal military installations, and rural areas.
Pierce County is part of the three-county Seattle Tacoma Bellevue MSA and as a subset of the MSA is the Tacoma-Lakewood Metropolitan Division
Employment situation for August 2025
Labor force and unemployment
-
The not seasonally adjusted unemployment rate for Pierce County was 5.0% in August 2025, up from 4.9% in July 2025 and up from 4.8% 12 months ago.
-
The labor force decreased over the year, losing 1,354 participants (down 0.3%).
Unemployment rate, not seasonally adjusted
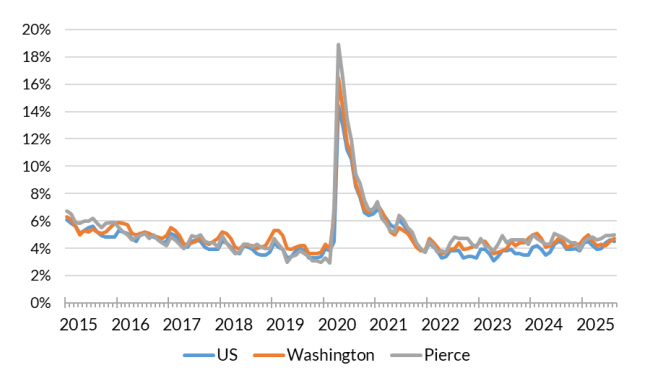
Source: Employment Security Department/Labor Market Information and Research Division, Local area unemployment statistics
Payroll employment
-
Total nonfarm employment declined by 1,500 from July 2025 to August 2025.
-
Overall, employment growth continues but has slowed.
-
Over the month, employment increased in four major industry sectors, decreased in five and was unchanged in three. The largest increase was in private education and health services. The deepest loss occurred in government.
-
From August 2024 to August 2025, total nonfarm employment rose by 5,100 (1.5%).
-
Over the course of the year, employment in eight major industries expanded, three contracted and one was unchanged.
-
Of the industry sectors, employment in transportation, warehousing and utilities increased the most while professional and business services experienced the deepest one-year losses.
Nonfarm employment estimates, not seasonally adjusted, Pierce County
| NAICS Industry Title | Aug 2025 (Prelim) | Jul 2025 (Revised) | Aug 2024 (Revised) | Jul 2025 to Aug 2025 Change | Aug 2024 to Aug 2025 Change | Aug 2024 to Aug 2025 % Change |
|---|---|---|---|---|---|---|
| Total nonfarm | 347,900 | 349,400 | 342,800 | -1,500 | 5,100 | 1.5% |
| Total private (total nonfarm less government) | 288,200 | 287,900 | 283,800 | 300 | 4,400 | 1.6% |
| Goods-producing | 44,600 | 44,300 | 43,300 | 300 | 1,300 | 3.0% |
| - Mining, logging and construction | 28,400 | 28,000 | 26,600 | 400 | 1,800 | 6.8% |
| - Manufacturing | 16,200 | 16,300 | 16,700 | -100 | -500 | -3.0% |
| Service-providing | 303,300 | 305,100 | 299,500 | -1,800 | 3,800 | 1.3% |
| - Wholesale trade | 13,700 | 13,700 | 13,400 | 0 | 300 | 2.2% |
| - Retail trade | 36,600 | 36,600 | 36,500 | 0 | 100 | 0.3% |
| - Transportation, warehousing, and utilities | 74,200 | 74,100 | 71,200 | 100 | 3,000 | 4.2% |
| - Information | 2,000 | 2,000 | 2,000 | 0 | 0 | 0.0% |
| - Financial activities | 14,400 | 14,500 | 14,800 | -100 | -400 | -2.7% |
| - Professional and business services | 37,300 | 37,800 | 39,300 | -500 | -2,000 | -5.1% |
| - Private education and health services | 64,900 | 64,200 | 62,900 | 700 | 2,000 | 3.2% |
| - Leisure and hospitality | 36,800 | 37,200 | 36,700 | -400 | 100 | 0.3% |
| - Other services | 14,000 | 13,800 | 13,600 | 200 | 400 | 2.9% |
| - Government | 59,700 | 61,500 | 59,000 | -1,800 | 700 | 1.2% |
Note: Data benchmarked through March 2025, updated September 15, 2025.
Source: Employment Security Department/Labor Market Information and Research Division, Washington employment estimates (WA-QB & CES)
Detailed tables can be found on the source page in the third spreadsheet titled Current employment estimates, not seasonally adjusted.
Industry employment (covered employment)
Employment in government services makes up roughly 18% of all total nonfarm employment in Pierce County. Joint Base Lewis-McChord figures prominently, particularly through the proportion of federal workers employed. Emerald Queen Casino, which is classified within local government, is also a large employer in the area.
Pierce County serves as a regional provider of health care for the South Puget Sound. MultiCare Health System and Virginia Mason Franciscan Health are the largest providers of health care across the county.
Construction employment is important in Pierce County. Housing development has grown into local suburbs offering a lower cost alternative for commuters to King County. The continual need to upgrade and modernize facilities at the military base also helps support residential construction activity and military contract work for the construction industry.
Employment by industry, Pierce County 2024 annual average
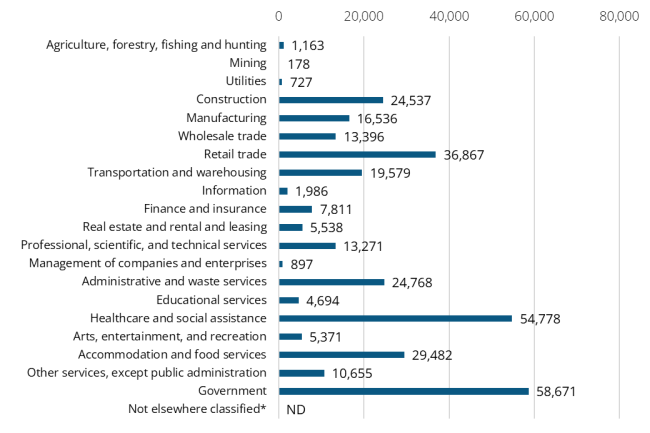
Source: Employment Security Department/Labor Market Information and Research Division, Covered Employment (QCEW)
Average annual covered employment in Pierce County was 333,491 in 2024. Covered employment refers to workers who received wages in Washington state and are eligible for state and federal unemployment insurance (UI) compensation programs.
Top five sectors in terms of employment in 2024:
-
Government (60,202)
-
Health care and social assistance (56,625)
-
Retail trade (36,054)
-
Accommodation and food services (29,575)
-
Administrative and waste management services (24,342)
Wages can vary substantially from one industry sector to another. The average annual wage in Pierce County for all industries was $70,396 in 2024.
The top five sectors in terms of wages in 2024:
-
Utilities ($127,860)
-
Information ($116,356)
-
Real estate and rental and leasing ($108,579)
-
Finance and insurance ($105,055)
-
Professional, scientific and technical services ($93,619)
Workforce demographics for Pierce County
Age
| Demographic characteristic | Total | Labor force participation rate | Unemployment rate |
|---|---|---|---|
| Population 16 years and over | 11,508 | 47.0% | 6.7% |
| 16 to 19 years | 558 | 45.5% | 22.0% |
| 20 to 24 years | 828 | 62.8% | 8.5% |
| 25 to 29 years | 533 | 86.5% | 5.2% |
| 30 to 34 years | 701 | 70.8% | 4.8% |
| 35 to 44 years | 1,309 | 79.8% | 6.6% |
| 45 to 54 years | 1,523 | 71.0% | 6.4% |
| 55 to 59 years | 1,230 | 50.1% | 4.9% |
| 60 to 64 years | 1,097 | 45.5% | 9.4% |
| 65 to 74 years | 2,417 | 16.6% | 0.0% |
| 75 years and over | 1,312 | 2.7% | 0.0% |
Race or Hispanic origin
| Demographic characteristic | Total | Labor force participation rate | Unemployment rate |
|---|---|---|---|
| White alone | 10,147 | 45.1% | 7.0% |
| Black or African American alone | 17 | 29.4% | 0.0% |
| American Indian and Alaska Native alone | 210 | 43.3% | 3.3% |
| Asian alone | 46 | 15.2% | 0.0% |
| Native Hawaiian and other Pacific Islander alone | 25 | 100.0% | 0.0% |
| Some other race alone | 195 | 53.3% | 0.0% |
| Two or more races | 868 | 69.2% | 6.8% |
| Hispanic or Latino origin (of any race) | 405 | 44.7% | 15.5% |
| White alone, not Hispanic or Latino | 10,079 | 45.3% | 7.0% |
| Population 20 to 64 years | 7,221 | 65.4% | 6.5% |
Sex
| Demographic characteristic | Total | Labor force participation rate | Unemployment rate |
|---|---|---|---|
| Male | 3,712 | 71.1% | 9.0% |
| Female | 3,509 | 59.2% | 3.4% |
Females with children
| Demographic characteristic | Total | Labor force participation rate | Unemployment rate |
|---|---|---|---|
| With own children under 18 | 1,039 | 68.2% | 1.7% |
| With own children under 6 only | 253 | 83.8% | 1.4% |
| With own children under 6 and 6 to 17 | 176 | 63.6% | 0.0% |
| With own children 6 to 17 only | 610 | 63.1% | 2.3% |
Poverty status in the past 12 months
| Demographic characteristic | Total | Labor force participation rate | Unemployment rate |
|---|---|---|---|
| Below poverty level | 1,201 | 37.1% | 19.5% |
| At or above the poverty level | 5,970 | 71.6% | 5.1% |
Disability status
| Demographic characteristic | Total | Labor force participation rate | Unemployment rate |
|---|---|---|---|
| With any disability | 1,302 | 30.3% | 8.4% |
Educational attainment
| Demographic characteristic | Total | Labor force participation rate | Unemployment rate |
|---|---|---|---|
| Population 25 to 64 years | 6,393 | 65.7% | 6.3% |
| Less than high school graduate | 336 | 39.3% | 5.3% |
| High school graduate (includes equivalency) | 2,294 | 65.5% | 10.2% |
| Some college or associate's degree | 2,586 | 66.6% | 3.4% |
| Bachelor's degree or higher | 1,177 | 71.5% | 5.1% |
Source: U.S. Census Bureau, American Community Survey 5-year estimates, S2301 | Employment Status
Visit the U.S. Census Bureau website for more quick facts about Pierce County.
This workforce product was funded by a grant awarded by the U.S. Department of Labor's Employment and Training Administration. The product was created by the recipient and does not necessarily reflect the official position of the U.S. Department of Labor. The Department of Labor makes no guarantees, warranties, or assurances of any kind, expressed or implied, with respect to such information, including any information on linked sites and including, but not limited to, accuracy of the information or its completeness, timeliness, usefulness, adequacy, continued availability, or ownership. This product is copyrighted by the institution that created it. Internal use by an organization and/or personal use by an individual for non-commercial purposes is permissible. All other uses require the prior authorization of the copyright owner.