

August 2025 highlights
Since July, the not seasonally adjusted unemployment rate increased from 4.6% to 4.7%, and total nonfarm employment lost 300 jobs.
Summary
The not seasonally adjusted unemployment rate was 4.7% in August 2025, up from 4.6% in July 2025 and below 5.1% in August 2024. Skagit County’s labor force at 59,935 workers gained 634 workers over the month in August 2025 but was 762 workers below last year. There were approximately 364 initial claim filings for unemployment insurance over the month. Total nonfarm employment, at 53,500 jobs, decreased by 300 jobs since July and was 800 jobs lower than last year.
Location
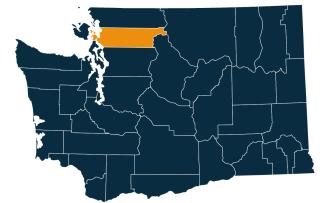
Skagit County, located in northwest Washington, is situated between Whatcom County to the north and Snohomish County to the south. The Salish Sea lies to the west and the Cascade Mountains rise to the east. The Skagit River runs through the largest population centers of the county. Although most of Skagit County is continental, it includes several islands in the Salish Sea.
Skagit County ranges in elevation from sea level to a high point of 9,114 feet at the non-volcanic peak, Mount Buckner. Glacier Peak, located in neighboring Snohomish County, is noted by the U.S. Geologic Survey as one of the most active and explosive of Washington's volcanoes. Glacier Peak shaped the geography of the Skagit River valley through tremendous mud and debris flows (lahars) that at times traveled more than 100 miles to reach the Salish Sea.
Skagit County is synonymous with the Mount Vernon-Anacortes Metropolitan Statistical Area (MSA) and is part of the Northwest Workforce Development Area. Visit the Workforce Training & Education Coordinating Board website for information about the 12 regions.
Employment situation for August 2025
Labor force and unemployment
-
The not seasonally adjusted unemployment rate was 4.7% in August 2025, up from 4.6% in July and below 5.1% in August 2024.
- The labor force, at 59,935 workers, increased by 634 workers since July, and lost 762 workers compared to August 2024.
Unemployment rate, not seasonally adjusted
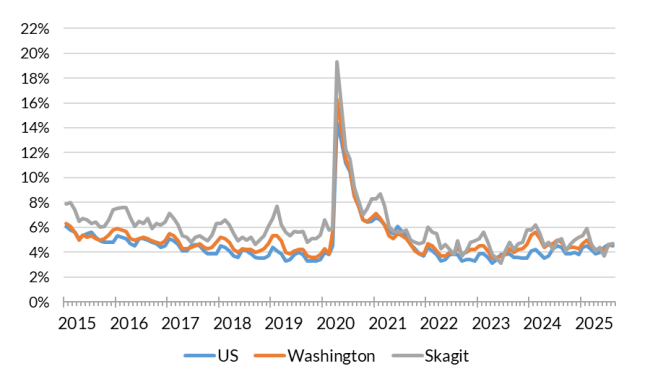
Source: Employment Security Department/Labor Market Information and Research Division, Local area unemployment statistics
Payroll employment
- Total nonfarm employment at 53,500 lost 300 jobs in August 2025 and was 800 jobs below last year.
- Mining, logging and construction was up 100 jobs over the month and was 200 jobs above August 2024.
- Manufacturing was unchanged from July and was 200 jobs lower than last year’s count.
- Private service providing lost 400 jobs over the month and was 800 jobs below last year.
- Retail trade was unchanged over the month and was 200 jobs lower than last year.
- Leisure and hospitality was unchanged over the month and was 200 jobs under August 2024.
Nonfarm employment estimates, not seasonally adjusted, Skagit County
| NAICS Industry Title | Aug 2025 (Prelim) | Jul 2025 (Revised) | Aug 2024 (Revised) | Jul 2025 to Aug 2025 Change | Aug 2024 to Aug 2025 Change | Aug 2024 to Aug 2025 % Change |
|---|---|---|---|---|---|---|
| Total nonfarm | 53,500 | 53,800 | 54,300 | -300 | -800 | -1.5% |
| Total private (total nonfarm less government) | 40,900 | 41,000 | 41,900 | -100 | -1,000 | -2.4% |
| Goods-producing | 11,500 | 11,400 | 11,500 | 100 | 0 | 0.0% |
| - Mining, logging and construction | 5,000 | 4,900 | 4,800 | 100 | 200 | 4.2% |
| - Manufacturing | 6,500 | 6,500 | 6,700 | 0 | -200 | -3.0% |
| Service-providing | 42,000 | 42,400 | 42,800 | -400 | -800 | -1.9% |
| - Trade, transportation, and utilities | 10,000 | 10,000 | 10,200 | 0 | -200 | -2.0% |
| - Retail trade | 6,700 | 6,700 | 6,900 | 0 | -200 | -2.9% |
| - Leisure and hospitality | 5,400 | 5,400 | 5,600 | 0 | -200 | -3.6% |
| - Government | 12,600 | 12,800 | 12,400 | -200 | 200 | 1.6% |
Note: Data benchmarked through March 2025, updated September 15, 2025.
Source: Employment Security Department/Labor Market Information and Research Division, Washington employment estimates (WA-QB & CES)
Detailed tables can be found on the source page in the third spreadsheet titled Current employment estimates, not seasonally adjusted.
Industry employment (covered employment)
Employment by industry, Skagit County 2024 annual average
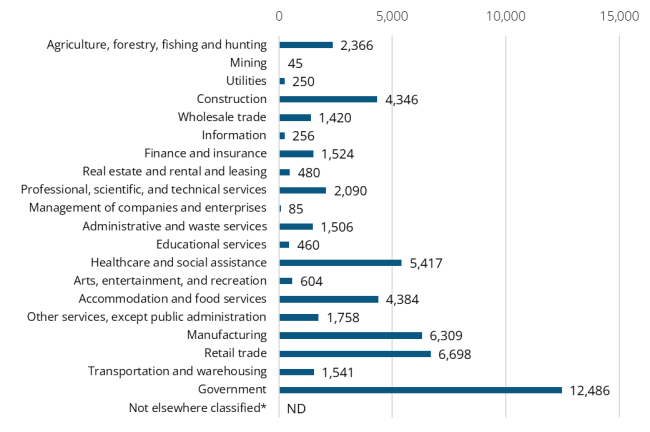
Source: Employment Security Department/Labor Market Information and Research Division, Covered Employment (QCEW)
Average annual covered employment in Skagit County was 54,022 in 2024. Covered employment refers to workers who received wages in Washington state and are eligible for state and federal unemployment insurance (UI) compensation programs.
Top sectors in terms of employment in 2024:
- Government (12,486)
- Retail trade (6,698)
- Manufacturing (6,309)
- Health care and social assistance (5,417)
- Accommodation and food services (4,384)
The average annual wage in Washington state for all industries was $92,467 in 2024. The average annual wage in Skagit County was $65,456 in 2024.
Top sectors in terms of wages in 2024:
- Utilities ($133,899)
- Management of companies and enterprises ($101,618)
- Information ($93,873)
- Professional, scientific and technical services ($88,382)
- Construction ($88,180)
Workforce demographics in Skagit County
Age
| Demographic characteristic | Total | Labor force participation rate | Unemployment rate |
|---|---|---|---|
| Population 16 years and over | 106,270 | 58.5% | 4.9% |
| 16 to 19 years | 6,069 | 45.4% | 14.1% |
| 20 to 24 years | 6,705 | 82.0% | 9.0% |
| 25 to 29 years | 8,033 | 83.0% | 3.7% |
| 30 to 34 years | 8,237 | 81.3% | 3.4% |
| 35 to 44 years | 16,398 | 81.6% | 5.5% |
| 45 to 54 years | 14,546 | 82.4% | 3.2% |
| 55 to 59 years | 8,206 | 71.5% | 2.8% |
| 60 to 64 years | 9,266 | 52.1% | 3.4% |
| 65 to 74 years | 17,301 | 22.4% | 5.1% |
| 75 years and over | 11,509 | 5.7% | 3.3% |
Race or Hispanic origin
| Demographic characteristic | Total | Labor force participation rate | Unemployment rate |
|---|---|---|---|
| White alone | 84,489 | 55.7% | 4.2% |
| Black or African American alone | 978 | 68.3% | 3.0% |
| American Indian and Alaska Native alone | 1,532 | 68.3% | 12.3% |
| Asian alone | 2,323 | 61.0% | 1.6% |
| Native Hawaiian and other Pacific Islander alone | 258 | 86.8% | 13.8% |
| Some other race alone | 9,011 | 74.7% | 5.9% |
| Two or more races | 7,679 | 65.9% | 8.5% |
| Hispanic or Latino origin (of any race) | 16,426 | 73.4% | 8.1% |
| White alone, not Hispanic or Latino | 80,165 | 54.8% | 4.0% |
| Population 20 to 64 years | 71,391 | 76.9% | 4.4% |
Sex
| Demographic characteristic | Total | Labor force participation rate | Unemployment rate |
|---|---|---|---|
| Male | 35,940 | 82.6% | 4.8% |
| Female | 35,451 | 71.2% | 3.9% |
Females with children
| Demographic characteristic | Total | Labor force participation rate | Unemployment rate |
|---|---|---|---|
| With own children under 18 | 12,657 | 70.0% | 3.1% |
| With own children under 6 only | 3,368 | 59.2% | 3.6% |
| With own children under 6 and 6 to 17 | 2,183 | 60.9% | 3.1% |
| With own children 6 to 17 only | 7,106 | 77.9% | 2.9% |
Poverty status in the past 12 months
| Demographic characteristic | Total | Labor force participation rate | Unemployment rate |
|---|---|---|---|
| Below poverty level | 8,121 | 45.4% | 21.3% |
| At or above the poverty level | 62,877 | 81.4% | 3.1% |
Disability status
| Demographic characteristic | Total | Labor force participation rate | Unemployment rate |
|---|---|---|---|
| With any disability | 8,724 | 45.9% | 10.7% |
Educational attainment
| Demographic characteristic | Total | Labor force participation rate | Unemployment rate |
|---|---|---|---|
| Population 25 to 64 years | 64,686 | 76.4% | 3.9% |
| Less than high school graduate | 6,643 | 70.5% | 6.0% |
| High school graduate (includes equivalency) | 17,503 | 75.4% | 4.0% |
| Some college or associate's degree | 23,011 | 72.8% | 4.8% |
| Bachelor's degree or higher | 17,529 | 84.5% | 2.0% |
Source: U.S. Census Bureau, American Community Survey 5-year estimates, S2301 | Employment Status
This workforce product was funded by a grant awarded by the U.S. Department of Labor's Employment and Training Administration. The product was created by the recipient and does not necessarily reflect the official position of the U.S. Department of Labor. The Department of Labor makes no guarantees, warranties, or assurances of any kind, expressed or implied, with respect to such information, including any information on linked sites and including, but not limited to, accuracy of the information or its completeness, timeliness, usefulness, adequacy, continued availability, or ownership. This product is copyrighted by the institution that created it. Internal use by an organization and/or personal use by an individual for non-commercial purposes is permissible. All other uses require the prior authorization of the copyright owner.