

August 2025 highlights
In August, the not seasonally adjusted unemployment rate remains low, increasing slightly to 4.6% over the month. Total nonfarm employment decreased by 1,000 jobs over the month.
Summary
The not seasonally adjusted unemployment rate was 4.6% in August 2025. This is up from 4.5% in July 2025, and down from 4.8% in August 2024. Whatcom County’s labor force was 111,310 workers. There were approximately 588 initial claim filings for unemployment insurance over the month. Total nonfarm employment decreased by 1,000 jobs to 94,200 jobs over the month and was 1,500 jobs below last year.
Location
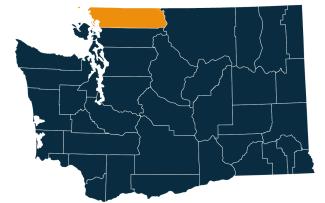
Whatcom County is in northwest Washington. It borders British Columbia, Canada, to the north, Skagit County to the south, and Okanogan County to the east. The Salish Sea lies to the west and the Cascade Mountains rise to the east. Whatcom County’s elevation ranges from sea level to 10,781 feet atop active volcano Mount Baker, also known as Kulshan.
Whatcom is part of the Bellingham Metropolitan Statistical Area. It is also part of Workforce Development Area 3, along with Skagit, San Juan and Island counties. Visit the Workforce Training & Education Coordinating Board website for information about the 12 regions.
Employment situation for August 2025
Labor force and unemployment
- The not seasonally adjusted unemployment rate was 4.6% in August 2025, up from 4.5% in July and below the 4.8% of August 2024.
- The labor force, at 111,310 workers, has contracted 2,195 workers since August 2024 and gained 571 workers over the month.
Unemployment rate, not seasonally adjusted
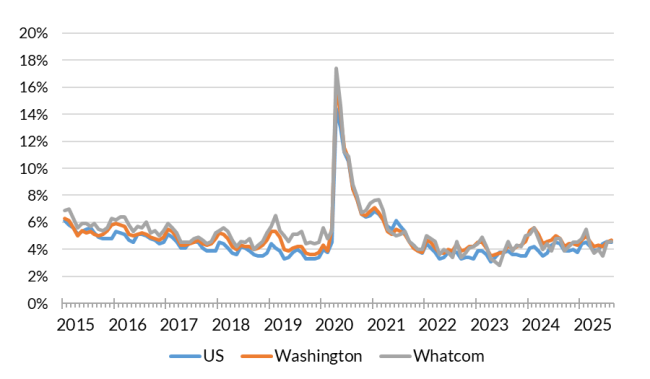
Source: Employment Security Department/Labor Market Information and Research Division, Local area unemployment statistics
Payroll employment
- Total nonfarm employment in August 2025, at 94,200 jobs, declined 1,000 jobs from July and is 1,500 jobs lower compared to August 2024.
- Goods producing industry jobs, at 18,500 jobs, were up 100 jobs over the month and 1,200 jobs above last year.
- Private service providing industry jobs, at 60,100 jobs, were down 100 jobs over the month and 1,400 jobs below last year.
- Trade, transportation and utilities was unchanged over the month and was 500 jobs below last year.
- Leisure and hospitality was unchanged over the month and 100 jobs below August 2024.
Nonfarm employment estimates, not seasonally adjusted, Whatcom County
| NAICS Industry Title | Aug 2025 (Prelim) | Jul 2025 (Revised) | Aug 2024 (Revised) | Jul 2025 to Aug 2025 Change | Aug 2024 to Aug 2025 Change | Aug 2024 to Aug 2025 % Change |
|---|---|---|---|---|---|---|
| Total nonfarm | 94,200 | 95,200 | 95,700 | -1,000 | -1,500 | -1.6% |
| Total private (total nonfarm less government) | 78,600 | 78,600 | 78,800 | 0 | -200 | -0.3% |
| Goods-producing | 18,500 | 18,400 | 17,300 | 100 | 1,200 | 6.9% |
| - Mining, logging and construction | 8,900 | 8,800 | 8,200 | 100 | 700 | 8.5% |
| - Manufacturing | 9,600 | 9,600 | 9,100 | 0 | 500 | 5.5% |
| Service-providing | 75,700 | 76,800 | 78,400 | -1,100 | -2,700 | -3.4% |
| - Trade, transportation, and utilities | 15,800 | 15,800 | 16,300 | 0 | -500 | -3.1% |
| - Retail trade | 10,600 | 10,600 | 11,000 | 0 | -400 | -3.6% |
| - Financial activities | 3,900 | 3,900 | 4,300 | 0 | -400 | -9.3% |
| - Professional and business services | 9,100 | 9,100 | 9,400 | 0 | -300 | -3.2% |
| - Leisure and hospitality | 10,500 | 10,500 | 10,600 | 0 | -100 | -0.9% |
| - Government | 15,600 | 16,600 | 16,900 | -1,000 | -1,300 | -7.7% |
Note: Data benchmarked through March 2025, updated September 15, 2025.
Source: Employment Security Department/Labor Market Information and Research Division, Washington employment estimates (WA-QB & CES)
Detailed tables can be found on the source page in the third spreadsheet titled Current employment estimates, not seasonally adjusted.
Industry employment (covered employment)
Employment by industry, Whatcom County 2024 annual average
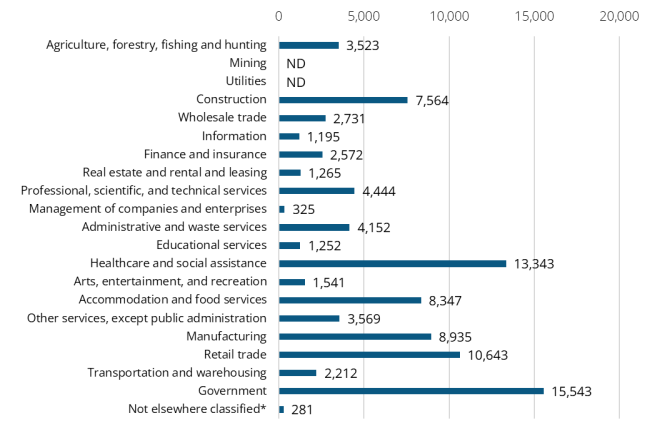
Source: Employment Security Department/Labor Market Information and Research Division, Covered Employment (QCEW)
Note: ND stands for not disclosed. ND is used to avoid disclosing data for individual employers. Industries labeled ND are grouped in the Not elsewhere classified category.
Average annual covered employment in Whatcom County was 93,436 in 2024. Covered employment refers to workers who received wages in Washington state and are eligible for state and federal unemployment insurance (UI) compensation programs.
The average annual wage in Washington state for all industries was $92,467 in 2024. The average annual wage in Whatcom County was $65,170 in 2024.
Top sectors in terms of average annual employment in 2024:
- Government (15,543)
- Health care and social assistance (13,343)
- Retail trade (10,643)
- Manufacturing (8,935)
- Accommodation and food services (8,347)
Top sectors in terms of annual average wages in 2024:
- Not elsewhere classified ($140,140)
- Information ($115,533)
- Finance and insurance ($106,163)
- Professional, scientific and technical services ($93,384)
- Management of companies and enterprises ($87,885)
Workforce demographics in Whatcom County
Age
| Demographic characteristic | Total | Labor force participation rate | Unemployment rate |
|---|---|---|---|
| Population 16 years and over | 190,060 | 63.0% | 5.1% |
| 16 to 19 years | 11,987 | 47.0% | 23.0% |
| 20 to 24 years | 22,680 | 78.3% | 8.8% |
| 25 to 29 years | 16,170 | 81.7% | 4.7% |
| 30 to 34 years | 15,366 | 79.1% | 2.8% |
| 35 to 44 years | 29,098 | 87.7% | 2.4% |
| 45 to 54 years | 25,513 | 82.2% | 3.4% |
| 55 to 59 years | 12,648 | 74.2% | 3.5% |
| 60 to 64 years | 14,343 | 58.8% | 3.8% |
| 65 to 74 years | 26,015 | 22.1% | 2.8% |
| 75 years and over | 16,240 | 5.5% | 11.7% |
Race or Hispanic origin
| Demographic characteristic | Total | Labor force participation rate | Unemployment rate |
|---|---|---|---|
| White alone | 153,135 | 61.7% | 5.0% |
| Black or African American alone | 1,729 | 67.9% | 11.4% |
| American Indian and Alaska Native alone | 3,473 | 59.8% | 10.2% |
| Asian alone | 8,345 | 66.2% | 2.5% |
| Native Hawaiian and other Pacific Islander alone | 576 | 75.2% | 4.5% |
| Some other race alone | 7,626 | 77.1% | 3.6% |
| Two or more races | 15,176 | 66.9% | 5.8% |
| Hispanic or Latino origin (of any race) | 16,622 | 70.7% | 4.1% |
| White alone, not Hispanic or Latino | 149,235 | 61.4% | 5.0% |
| Population 20 to 64 years | 135,818 | 79.1% | 4.2% |
Sex
| Demographic characteristic | Total | Labor force participation rate | Unemployment rate |
|---|---|---|---|
| Male | 67,970 | 84.0% | 4.5% |
| Female | 67,848 | 74.2% | 3.8% |
Females with children
| Demographic characteristic | Total | Labor force participation rate | Unemployment rate |
|---|---|---|---|
| With own children under 18 | 20,867 | 71.3% | 3.2% |
| With own children under 6 only | 4,727 | 66.0% | 4.4% |
| With own children under 6 and 6 to 17 | 4,423 | 63.2% | 3.4% |
| With own children 6 to 17 only | 11,717 | 76.5% | 2.7% |
Poverty status in the past 12 months
| Demographic characteristic | Total | Labor force participation rate | Unemployment rate |
|---|---|---|---|
| Below poverty level | 18,236 | 51.2% | 16.6% |
| At or above the poverty level | 116,464 | 83.9% | 3.0% |
Disability status
| Demographic characteristic | Total | Labor force participation rate | Unemployment rate |
|---|---|---|---|
| With any disability | 15,157 | 51.0% | 8.1% |
Educational attainment
| Demographic characteristic | Total | Labor force participation rate | Unemployment rate |
|---|---|---|---|
| Population 25 to 64 years | 113,138 | 79.3% | 3.3% |
| Less than high school graduate | 7,523 | 66.7% | 1.7% |
| High school graduate (includes equivalency) | 23,492 | 74.7% | 4.1% |
| Some college or associate's degree | 39,185 | 76.1% | 3.6% |
| Bachelor's degree or higher | 42,938 | 86.8% | 2.9% |
Source: U.S. Census Bureau, American Community Survey 5-year estimates, S2301 | Employment Status
Visit the U.S. Census Bureau website for more quick facts about Whatcom County.
This workforce product was funded by a grant awarded by the U.S. Department of Labor's Employment and Training Administration. The product was created by the recipient and does not necessarily reflect the official position of the U.S. Department of Labor. The Department of Labor makes no guarantees, warranties, or assurances of any kind, expressed or implied, with respect to such information, including any information on linked sites and including, but not limited to, accuracy of the information or its completeness, timeliness, usefulness, adequacy, continued availability, or ownership. This product is copyrighted by the institution that created it. Internal use by an organization and/or personal use by an individual for non-commercial purposes is permissible. All other uses require the prior authorization of the copyright owner.