

Posted October 2025
August 2025 highlights
The unemployment rate in the county was 4.2% in August 2025, which increased from 4.0% in July 2025 and decreased from 4.5% in August 2024. Overall job trends show that Walla Walla County experienced an increase in employment, adding 100 jobs, a 0.4% increase compared to August 2024, bringing total payroll employment to 27,400.
Summary
Walla Walla County’s economy remains diverse, with key contributions from agriculture, tourism, health care, education, manufacturing and retail trade. The county continues to be recognized for its agricultural output, particularly wheat, onions, potatoes and wine grapes and its thriving wine industry, which now includes more than 185 wineries. Tourism has rebounded strongly, fueled by the county’s vibrant art scene and expanding wine tourism infrastructure.
According to QCEW 2024 data, total covered employment reached 29,090 jobs, a 0.3% increase from 2023. The annual payroll rose to approximately $1.62 billion, reflecting both job growth and rising wages across sectors. Health care and educational services remain foundational employment pillars, while manufacturing and retail trade have shown renewed strength, particularly in food processing and specialty retail.
As of August 2025, the unemployment rate stood at 4.2%, down from 4.5% in 2024, indicating a tightening labor market and improved job placement. The labor force numbered 28,603, with 1,192 individuals actively seeking work, a 7.3% decrease from the previous year.
Workforce development initiatives continue to prioritize skill enhancement in agriculture, manufacturing and hospitality, ensuring a competitive and adaptable local workforce. Economic diversification efforts have expanded, with increased support for small businesses, entrepreneurship and sustainable tourism, positioning Walla Walla County for long-term resilience and growth.
Walla Walla County geographic overview
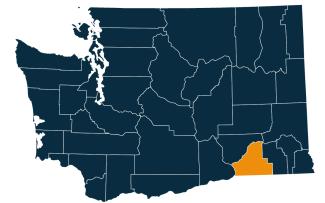
Walla Walla County is in the southeastern part of Washington. It is part of the Walla Walla metropolitan area. The city of Walla Walla is the county seat and the largest city in the county. Walla Walla County’s population was 62,584 in the 2020 census. In 2022, the Census estimated the population at 61,890, which is a decrease of 1.1% from the 2020 census.
The county covers 1,299 square miles, including 29 square miles of water. It features a mix of agricultural land and rolling prairie-like terrain.
Walla Walla County was created out of a larger area in 1854 and was named after the Walla Walla tribe.
Washington has 12 regional Workforce Development Areas. Walla Walla County is part of Area 10, the Eastern Washington Partnership. Visit the Workforce Training & Education Coordinating Board website for information about the workforce regions.
Walla Walla County employment situation for August 2025
Monthly labor force and unemployment
-
As of August 2025, Walla Walla County total labor force and employment increased and unemployment decreased since August 2024.
-
Walla Walla County has more than 28,603 people in the labor force, with an increase of 0.4% or 126 workers from August 2024, while employed workforce increased by 0.8% or 220 workers and unemployed workers decreased by 7.3% or 94 workers. About 1,192 people were unemployed and looking for work.
-
The unemployment rate in the county was 4.2% in August 2025, which increased from 4.0% in July 2025 and unemployment rate decreased from 4.5% in August 2024.
Unemployment rate, not seasonally adjusted
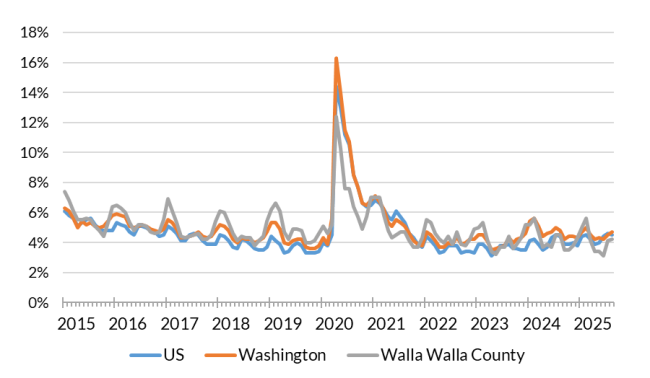
Source: Employment Security Department/Labor Market Information and Research Division, Local area unemployment statistics
Monthly nonfarm payroll employment in Walla Walla MSA
-
Overall job trends show Walla Walla County experienced an increase in employment, adding 100 jobs, a 0.4% increase compared to August 2024, bringing total payroll employment to 27,400. The private sector expended by 300 jobs or 1.4%, while government employment decreased by 200 jobs or 3.2%, year-over-year.
-
Industries with growth include private education and health services, which rose 3.0%, adding 200 jobs, bringing the total to 6,900 positions. Manufacturing industry increased by 200 jobs or 5.1% over the year. Financial activities saw strong gains, increasing 12.5% with the addition of 100 jobs and other services industry cluster increased by 100 jobs or 20.0%, year-over-year.
-
Industries facing declines wholesale trade and retail trade declining by 200 and 100 jobs (22.2% and 4.2%), respectfully. All other industries remained unchanged.
-
Government employment decreased by 200 jobs or 3.2%, year-over-year. Federal and state governments decreased by 100 jobs each (5.3% or 5.9%), respectfully. Local government remained unchanged.
Nonfarm employment estimates, not seasonally adjusted, Walla Walla MSA
| NAICS Industry Title | Aug 2025 (Prelim) | Jul 2025 (Revised) | Aug 2024 (Revised) | Jul 2025 to Aug 2025 Change | Aug 2024 to Aug 2025 Change | Aug 2024 to Aug 2025 % Change |
|---|---|---|---|---|---|---|
| Total nonfarm | 27,400 | 27,600 | 27,300 | -200 | 100 | 0.4% |
| Total private (total nonfarm less government) | 21,400 | 21,300 | 21,100 | 100 | 300 | 1.4% |
| Goods-producing | 5,400 | 5,400 | 5,200 | 0 | 200 | 3.8% |
| - Mining, logging and construction | 1,300 | 1,300 | 1,300 | 0 | 0 | 0.0% |
| - Manufacturing | 4,100 | 4,100 | 3,900 | 0 | 200 | 5.1% |
| Service-providing | 22,000 | 22,200 | 22,100 | -200 | -100 | -0.5% |
| - Wholesale trade | 700 | 700 | 900 | 0 | -200 | -22.2% |
| - Retail trade | 2,300 | 2,300 | 2,400 | 0 | -100 | -4.2% |
| - Transportation, warehousing, and utilities | 600 | 600 | 600 | 0 | 0 | 0.0% |
| - Information | 200 | 200 | 200 | 0 | 0 | 0.0% |
| - Financial activities | 900 | 900 | 800 | 0 | 100 | 12.5% |
| - Professional and business services | 1,200 | 1,200 | 1,200 | 0 | 0 | 0.0% |
| - Private education and health services | 6,900 | 6,900 | 6,700 | 0 | 200 | 3.0% |
| - Leisure and hospitality | 2,600 | 2,600 | 2,600 | 0 | 0 | 0.0% |
| - Other services | 600 | 600 | 500 | 0 | 100 | 20.0% |
| - Government | 6,000 | 6,300 | 6,200 | -300 | -200 | -3.2% |
Note: Data benchmarked through March 2025, updated September 15, 2025.
Source: Employment Security Department/Labor Market Information and Research Division, Washington employment estimates (WA-QB & CES)
Detailed tables can be found on the source page in the third spreadsheet titled Current employment estimates, not seasonally adjusted.
Total covered employment in Walla Walla County
In 2024, Walla Walla County wages totaled approximately $1.62 billion, with an average annual wage of $55,812. Average annual covered employment was 29,090, reflecting a modest increase from the previous year. Covered employment includes workers who receive wages in Washington state and are eligible for state and federal unemployment insurance (UI) compensation programs.
The agriculture, forestry, fishing and hunting sector remained significant, employing 3,676 individuals with an average wage of $37,179. Manufacturing continued to be a major contributor, with 3,884 employees earning an average of $67,989. The government sector was the largest employer, with 6,242 employees and an average wage of $66,443.
Among private industries, finance and insurance offered the highest average wage at $91,791 for 569 employees, followed by professional, scientific and technical services, which paid an average of $81,112 to 500 employees. Retail trade, while employing 2,381 individuals, had a lower average wage of $35,853, consistent with national trends in service-sector compensation.
Overall, Walla Walla County’s 2024 employment trends reflect a diverse and resilient economy, with strong contributions from agriculture, manufacturing and government, alongside high-wage opportunities in professional services and finance.
Employment by industry, Walla Walla County 2024 annual average
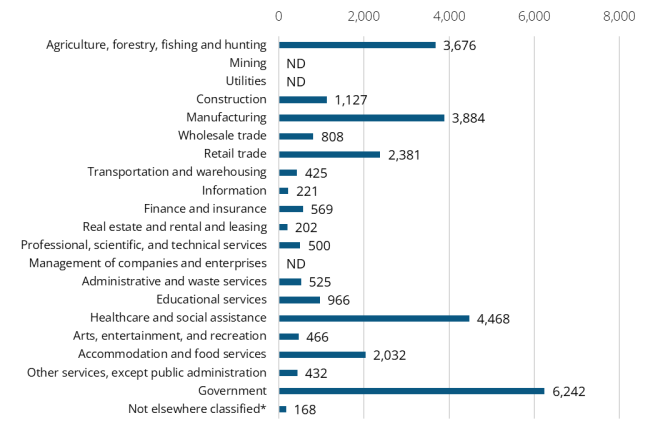
Source: Employment Security Department/Labor Market Information and Research Division, Covered Employment (QCEW)
Top sectors in terms of employment in 2024. These six sectors together account for nearly 79% of total covered employment in the county, highlighting a strong mix of public service, health, agriculture, and consumer-facing industries:
-
Government (6,242 jobs or 21.5% employment share)
-
Health care and social assistance (4,468 jobs or 15.4% employment share)
-
Manufacturing (3,884 jobs or 13.4% employment share)
-
Agriculture (3,676 jobs or 12.6% employment share)
-
Retail trade (2,381 jobs or 8.2% employment share)
-
Accommodations and food services (2,032 jobs or 7.0% employment share)
Wages can vary substantially from one industry sector to another. The 2024 average annual wage in Walla Walla for all industries was $55,812. Annual payroll totaled more than $1.62 billion.
The top sectors in terms of wages in 2024:
-
Finance and insurance ($91,791)
-
Professional, scientific and technical services ($81,112)
-
Manufacturing ($67,989)
-
Government ($66,443)
-
Wholesale trade ($65,959)
-
Construction ($62,824)
Workforce demographics in Walla Walla County
The labor force participation rate is highest among the 25-29 age group at 80.5%, while the 65 to 74 age group has the lowest at 26.5%. Male workers have a slightly higher participation rate (74.7%) compared to female workers (74.4%). People with a bachelor’s degree or higher have the highest participation rate at 87.1%, while those with less than a high school diploma have the lowest at 56.2%.
Visit the U.S. Census Bureau website for quick facts about Walla Walla County.
Age
| Demographic characteristic | Total | Labor force participation rate | Unemployment rate |
|---|---|---|---|
| Population 16 years and over | 50,787 | 59.1% | 5.7% |
| 16 to 19 years | 4,469 | 53.7% | 11.6% |
| 20 to 24 years | 5,318 | 78.4% | 12.0% |
| 25 to 29 years | 3,611 | 80.5% | 13.2% |
| 30 to 34 years | 3,838 | 79.4% | 3.7% |
| 35 to 44 years | 7,464 | 75.2% | 2.6% |
| 45 to 54 years | 6,645 | 75.0% | 1.3% |
| 55 to 59 years | 3,481 | 73.6% | 4.4% |
| 60 to 64 years | 3,888 | 58.0% | 1.7% |
| 65 to 74 years | 6,837 | 27.5% | 3.6% |
| 75 years and over | 5,236 | 3.6% | 1.6% |
Race or Hispanic origin
| Demographic characteristic | Total | Labor force participation rate | Unemployment rate |
|---|---|---|---|
| White alone | 39,181 | 57.6% | 5.1% |
| Black or African American alone | 1,033 | 53.0% | 0.7% |
| American Indian and Alaska Native alone | 756 | 58.1% | 20.3% |
| Asian alone | 986 | 44.8% | 13.8% |
| Native Hawaiian and other Pacific Islander alone | 136 | 39.0% | 0.0% |
| Some other race alone | 4,495 | 74.5% | 6.3% |
| Two or more races | 4,200 | 62.1% | 7.8% |
| Hispanic or Latino origin (of any race) | 10,149 | 70.9% | 8.5% |
| White alone, not Hispanic or Latino | 36,328 | 56.5% | 4.4% |
| Population 20 to 64 years | 34,245 | 74.6% | 5.3% |
Sex
| Demographic characteristic | Total | Labor force participation rate | Unemployment rate |
|---|---|---|---|
| Male | 18,197 | 74.7% | 5.6% |
| Female | 16,048 | 74.4% | 5.0% |
Females with children
| Demographic characteristic | Total | Labor force participation rate | Unemployment rate |
|---|---|---|---|
| With own children under 18 | 5,566 | 76.8% | 2.3% |
| With own children under 6 only | 943 | 64.1% | 0.0% |
| With own children under 6 and 6 to 17 | 1,232 | 73.9% | 5.2% |
| With own children 6 to 17 only | 3,391 | 81.4% | 1.9% |
Poverty status in the past 12 months
| Demographic characteristic | Total | Labor force participation rate | Unemployment rate |
|---|---|---|---|
| Below poverty level | 3,068 | 48.9% | 15.7% |
| At or above the poverty level | 28,386 | 83.0% | 4.6% |
Disability status
| Demographic characteristic | Total | Labor force participation rate | Unemployment rate |
|---|---|---|---|
| With any disability | 3,899 | 46.8% | 11.9% |
Educational attainment
| Demographic characteristic | Total | Labor force participation rate | Unemployment rate |
|---|---|---|---|
| Population 25 to 64 years | 28,927 | 73.9% | 4.0% |
| Less than high school graduate | 3,530 | 56.2% | 8.3% |
| High school graduate (includes equivalency) | 6,633 | 68.6% | 5.8% |
| Some college or associate's degree | 10,667 | 72.9% | 3.3% |
| Bachelor's degree or higher | 8,097 | 87.1% | 2.4% |
Source: U.S. Census Bureau, American Community Survey 5-year estimates, S2301 | Employment Status
This workforce product was funded by a grant awarded by the U.S. Department of Labor's Employment and Training Administration. The product was created by the recipient and does not necessarily reflect the official position of the U.S. Department of Labor. The Department of Labor makes no guarantees, warranties, or assurances of any kind, expressed or implied, with respect to such information, including any information on linked sites and including, but not limited to, accuracy of the information or its completeness, timeliness, usefulness, adequacy, continued availability, or ownership. This product is copyrighted by the institution that created it. Internal use by an organization and/or personal use by an individual for non-commercial purposes is permissible. All other uses require the prior authorization of the copyright owner.