

Posted October 2025
August 2025 highlights
In August, the not seasonally adjusted unemployment rate decreased from 4.7% to 4.5% over the year and total nonfarm employment in Kennewick-Pasco-Richland MSA decreased by 0.5% over the year.
Summary
Between 2019 and 2024, Benton County experienced steady economic development across multiple sectors. Agriculture, food processing, health care, education, and research (especially activity surrounding the Hanford Site) remained central to the county’s growth. The post-pandemic recovery brought stabilization in employment, with notable expansion in health care, education, and construction through 2023. However, 2024 saw a slowdown in job creation, with fewer than 1,000 net new jobs added — the lowest annual gain in over a decade, excluding the pandemic.
The unemployment rate averaged 4.6% in mid-2025, slightly higher than the previous year. While some sectors contracted — including agriculture, real estate, manufacturing, finance and insurance, accommodation and food services, and retail trade — others expanded, particularly health care and social assistance, professional and technical services, and government employment.
The Hanford Project continues to anchor Benton County’s scientific and economic landscape, while Washington State University’s expansion has helped attract manufacturers and strengthen the local workforce. Economic diversification efforts have focused on workforce development, small business support, and innovation. Today, Benton County’s economy is marked by its diversity, with strong activity in medical equipment, education, and wine tourism, centered around Kennewick, Richland, and Prosser.
Benton County geographic overview
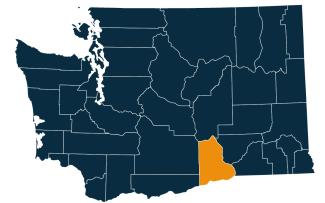
Benton County is in the south-central part of Washington. It is part of the Tri-Cities metropolitan area, which includes Kennewick and Richland. The city of Prosser is the county seat. Kennewick is the largest city in the county. Benton County’s population was 206,873 in the 2020 census. In 2022, the Census estimated the population at 212,791, which is 2.9% growth from the 2020 census.
The county covers 1,760 square miles, including 60 square miles of water. It features a mix of agricultural land and rolling prairie-like terrain.
Benton County was created out of Klickitat and Yakima counties in 1905 and was named after Thomas Hart Benton, a U.S. Senator from Missouri.
Washington has 12 regional Workforce Development Areas. Benton County is part of Area 11, the Benton-Franklin Workforce Development Council. Visit the Workforce Training & Education Coordinating Board website for information about the workforce regions.
Benton County employment situation for August 2025
Monthly labor force and unemployment in Benton County, Washington
-
As of August 2025, Benton County total labor force, employment and unemployment decreased since August 2024.
-
Benton County has over 103,713 people in the labor force, with a decrease of 0.4% or 367 workers from August 2024. Employed workforce decreased by 0.1% or 140 workers from August 2024 to August 2025. Unemployed workers decreased by 4.6% or 227 workers and about 4,669 people were unemployed and looking for work.
-
The unemployment rate in the county was 4.5% in August 2025, which remained the same as in July 2025 and decreased from 4.7% in August 2024.
Unemployment rate, not seasonally adjusted
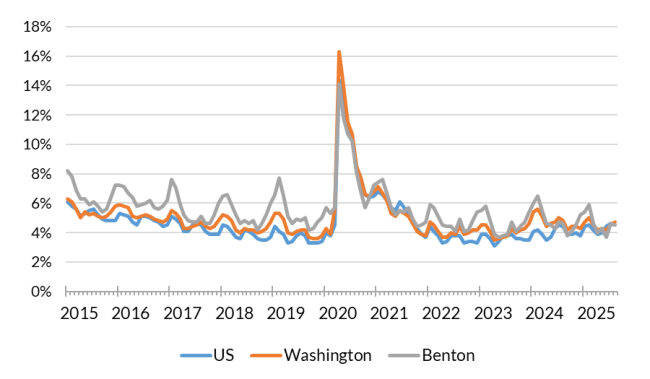
Source: Employment Security Department/Labor Market Information and Research Division, Local area unemployment statistics
Monthly nonfarm payroll employment Kennewick-Pasco-Richland MSA
-
Overall job trends show the Kennewick-Pasco-Richland Metro area had total nonfarm employment of 128,500 jobs in August 2025, representing a 0.5% decrease with 700 jobs decrease from August 2024. The private sector expanded by 300 jobs (0.3%), while government employment declined by 1,000 jobs (5.3%).
-
Industries with notable growth include private education and health services expanded by 700 jobs (3.4%). Construction industry added over 500 new jobs or 4.3% over the year, followed by wholesale trade with 100 new jobs (2.7%) and other services cluster with 2.8% or 100 jobs growth.
-
Industries facing declines include manufacturing, which posted a drop of 600 jobs (6.1%). Financial activities contracted by 100 jobs (2.4%). Information industry decreased by 100 jobs (12.5%) Professional and business services recorded a decrease over the year of 300 jobs (1.3%) and leisure and hospitality decreased by 100 jobs or 0.8%.
-
Government employment totaled 18,000 jobs, reflecting a 5.3% decrease (1,000 jobs). Local government fell by 800 jobs (5.4%) and state government employment declined by 300 jobs (10.0%), and federal government employment added 100 jobs (8.3%).
Nonfarm employment estimates, not seasonally adjusted, Kennewick-Pasco-Richland Metropolitan Statistical Area (Benton and Franklin Counties)
| NAICS Industry Title | Aug 2025 (Prelim) | Jul 2025 (Revised) | Aug 2024 (Revised) | Jul 2025 to Aug 2025 Change | Aug 2024 to Aug 2025 Change | Aug 2024 to Aug 2025 % Change |
|---|---|---|---|---|---|---|
| Total nonfarm | 128,500 | 129,300 | 129,200 | -800 | -700 | -0.5% |
| Total private (total nonfarm less government) | 110,500 | 110,800 | 110,200 | -300 | 300 | 0.3% |
| Goods-producing | 21,400 | 21,300 | 21,500 | 100 | -100 | -0.5% |
| - Mining, logging and construction | 12,200 | 12,100 | 11,700 | 100 | 500 | 4.3% |
| - Manufacturing | 9,200 | 9,200 | 9,800 | 0 | -600 | -6.1% |
| Service-providing | 107,100 | 108,000 | 107,700 | -900 | -600 | -0.6% |
| - Wholesale trade | 3,800 | 3,800 | 3,700 | 0 | 100 | 2.7% |
| - Retail trade | 13,700 | 13,800 | 14,000 | -100 | -300 | -2.1% |
| - Transportation, warehousing, and utilities | 4,900 | 4,900 | 4,900 | 0 | 0 | 0.0% |
| - Information | 700 | 700 | 800 | 0 | -100 | -12.5% |
| - Financial activities | 4,000 | 4,100 | 4,100 | -100 | -100 | -2.4% |
| - Professional and business services | 23,600 | 23,700 | 23,900 | -100 | -300 | -1.3% |
| - Private education and health services | 21,400 | 21,500 | 20,700 | -100 | 700 | 3.4% |
| - Leisure and hospitality | 12,800 | 12,800 | 12,900 | 0 | -100 | -0.8% |
| - Other services | 3,700 | 3,700 | 3,600 | 0 | 100 | 2.8% |
| - Government | 18,000 | 18,500 | 19,000 | -500 | -1,000 | -5.3% |
Note: Data benchmarked through March 2025, updated September 15, 2025.
Source: Employment Security Department/Labor Market Information and Research Division, Washington employment estimates (WA-QB & CES)
Detailed tables can be found on the source page in the third spreadsheet titled Current employment estimates, not seasonally adjusted.
Total covered employment in Benton County
In 2024, Benton County’s covered employment saw a notable economic landscape. Benton County’s wages paid totaled $6.98 billion, with an average annual employment of 98,778 and an average annual wage of $70,759. The professional, scientific, and technical services sector led in high wages, averaging $121,269 annually with total employment of 9,859 in 2024, while administrative and waste services had significant employment at 10,759 with an average wage of $102,602.
Construction (8,277 jobs or 8.4% share of total employment), and health care and social assistance (15,658 jobs or 15.9% share of total employment) also showed strong employment figures, with average wages of $87,264 and $63,268, respectively. Retail trade had employment of 10,062 but lower wages at $39,429. Sectors like agriculture and accommodation and food services had lower average wages, reflecting the diverse economic landscape of the county. This figure reflects the diverse economic activities in the region, including agriculture, food processing, medical equipment manufacturing, energy production, and wine tourism.
Employment by industry, Benton County 2024 annual average
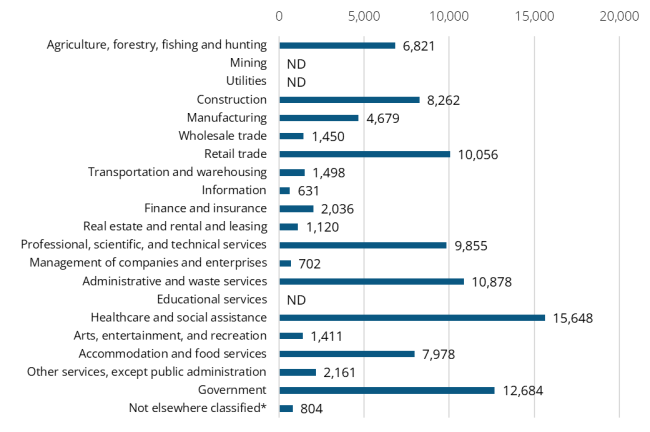
Source: Employment Security Department/Labor Market Information and Research Division, Covered Employment (QCEW)
Note: ND stands for not disclosed. ND is used to avoid disclosing data for individual employers. Industries labeled ND are grouped in the Not elsewhere classified category.
Average annual covered employment in Benton County was 98,779 in 2024. Covered employment refers to workers who received wages in Washington state and are eligible for state and federal unemployment insurance (UI) compensation programs.
Top five sectors in terms of employment in 2024:
-
Health care and social assistance (15,658 jobs or 15.9% employment share)
-
Government (12,684 jobs or 12.8% employment share)
-
Administrative and waste services (10,867 jobs or 11.0% employment share)
-
Retail trade (10,063 jobs or 10.2% employment share)
-
Professional, scientific, and technical services (9,859 jobs and 10.0% employment share)
-
Construction (8,277 jobs or 8.4% employment share)
-
Accommodation and food services (7,981 jobs or 8.1% employment share)
Wages can vary substantially from one industry sector to another. The average annual wage in Benton County for all industries was $70,759 with payrolls totaling more than $6.98 billion in 2024.
The top five sectors in terms of wage in 2024:
-
Professional, scientific, and technical services ($121,269)
-
Administrative and waste services ($102,602)
-
Management of companies and enterprises ($102,531)
-
Construction ($87,264)
-
Government ($81,876)
-
Finance and insurance ($81,027)
Workforce demographics in Benton County
The labor force participation rate is highest among the 30-34 age group at 85.1%, while the 65-74 age group has the lowest at 21.2%. The majority of the workforce is white (60.7% participation rate).
Male workers have a slightly higher participation rate (83.6%) compared to female workers (71.8%). People with a bachelor’s degree or higher have the highest participation rate at 86.0%, while those with less than a high school diploma have the lowest at 62.5%.
Visit the U.S. Census Bureau website for more quick facts about Benton County.
Age
| Demographic characteristic | Total | Labor force participation rate | Unemployment rate |
|---|---|---|---|
| Population 16 years and over | 161,217 | 62.4% | 5.0% |
| 16 to 19 years | 11,522 | 38.7% | 12.6% |
| 20 to 24 years | 12,756 | 79.9% | 7.2% |
| 25 to 29 years | 13,723 | 80.0% | 6.0% |
| 30 to 34 years | 14,511 | 85.1% | 6.1% |
| 35 to 44 years | 28,152 | 81.9% | 4.6% |
| 45 to 54 years | 23,260 | 78.7% | 3.0% |
| 55 to 59 years | 11,805 | 73.9% | 3.0% |
| 60 to 64 years | 12,766 | 57.9% | 3.7% |
| 65 to 74 years | 20,163 | 21.2% | 3.8% |
| 75 years and over | 12,559 | 6.8% | 4.2% |
Race or Hispanic origin
| Demographic characteristic | Total | Labor force participation rate | Unemployment rate |
|---|---|---|---|
| White alone | 121,267 | 60.7% | 4.6% |
| Black or African American alone | 2,480 | 68.3% | 10.2% |
| American Indian and Alaska Native alone | 1,458 | 69.3% | 3.6% |
| Asian alone | 5,011 | 65.3% | 3.4% |
| Native Hawaiian and other Pacific Islander alone | 370 | 66.2% | 6.5% |
| Some other race alone | 13,569 | 66.6% | 6.1% |
| Two or more races | 17,062 | 68.9% | 6.7% |
| Hispanic or Latino origin (of any race) | 33,791 | 71.6% | 5.9% |
| White alone, not Hispanic or Latino | 112,912 | 59.4% | 4.5% |
| Population 20 to 64 years | 116,973 | 77.8% | 4.7% |
Sex
| Demographic characteristic | Total | Labor force participation rate | Unemployment rate |
|---|---|---|---|
| Male | 59,321 | 83.6% | 4.8% |
| Female | 57,652 | 71.8% | 4.6% |
Females with children
| Demographic characteristic | Total | Labor force participation rate | Unemployment rate |
|---|---|---|---|
| With own children under 18 | 22,139 | 70.9% | 4.7% |
| With own children under 6 only | 4,083 | 70.1% | 7.4% |
| With own children under 6 and 6 to 17 | 4,773 | 54.5% | 4.6% |
| With own children 6 to 17 only | 13,283 | 77.1% | 4.0% |
Poverty status in the past 12 months
| Demographic characteristic | Total | Labor force participation rate | Unemployment rate |
|---|---|---|---|
| Below poverty level | 10,867 | 46.4% | 19.0% |
| At or above the poverty level | 105,447 | 81.5% | 3.9% |
Disability status
| Demographic characteristic | Total | Labor force participation rate | Unemployment rate |
|---|---|---|---|
| With any disability | 15,038 | 48.4% | 8.7% |
Educational attainment
| Demographic characteristic | Total | Labor force participation rate | Unemployment rate |
|---|---|---|---|
| Population 25 to 64 years | 104,217 | 77.5% | 4.4% |
| Less than high school graduate | 10,972 | 62.5% | 9.1% |
| High school graduate (includes equivalency) | 24,269 | 72.5% | 4.9% |
| Some college or associate's degree | 34,593 | 77.4% | 5.2% |
| Bachelor's degree or higher | 34,383 | 86.0% | 2.3% |
Source: U.S. Census Bureau, American Community Survey 5-year estimates, S2301 | Employment Status
This workforce product was funded by a grant awarded by the U.S. Department of Labor's Employment and Training Administration. The product was created by the recipient and does not necessarily reflect the official position of the U.S. Department of Labor. The Department of Labor makes no guarantees, warranties, or assurances of any kind, expressed or implied, with respect to such information, including any information on linked sites and including, but not limited to, accuracy of the information or its completeness, timeliness, usefulness, adequacy, continued availability, or ownership. This product is copyrighted by the institution that created it. Internal use by an organization and/or personal use by an individual for non-commercial purposes is permissible. All other uses require the prior authorization of the copyright owner.