

Posted October 2025
August 2025 highlights
The unemployment rate in the county was 4.8% in August 2025, which increased from 4.6% in July 2025. The unemployment rate decreased from 4.9% in August 2024. Overall job trends show that Klickitat County experienced a decline in job growth, losing 20 jobs, a 0.3% decrease compared to August 2024, with total payroll employment of 6,280.
Summary
Klickitat County continues to reflect its unique economic geography, with three distinct regions contributing to its overall performance. The western third remains anchored by unmanned aerial vehicle (drone) production, wood products and orchard-based fruit packing. The eastern third is dominated by vegetable farming and the Roosevelt Regional Landfill, while the central third, home to Goldendale and cultural assets like the Maryhill Museum, supports tourism, recreation and small-scale service industries. Vineyards and wineries have continued to expand countywide, reinforcing Klickitat’s growing role in Washington’s wine economy.
As of August 2025, Klickitat County’s labor force numbered 9,563, down from the previous year. Total nonfarm employment declined by 0.8% year-over-year, indicating modest contraction in the job market. The unemployment rate rose to 4.6% in mid-2025. Despite these fluctuations, Klickitat County is expected to maintain a gradual pace of economic diversification. Challenges ahead include securing funding for modernization of the Columbia River interstate bridge and expanding broadband infrastructure — both critical to enhancing regional connectivity and supporting future growth.
Klickitat County geographic overview
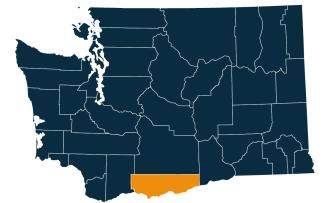
Klickitat County is in the south-central part of Washington. It is part of the Portland-Vancouver-Hillsboro metropolitan area. The city of Goldendale is the county seat and the largest city in the county. Klickitat County’s population was 22,735 in the 2020 census. In 2022, the Census estimated the population at 23,271, which is 2.4% growth from the 2020 census.
The county covers 1,904 square miles, including 33 square miles of water. It features a mix of forested areas and rugged terrain marked by rivers and mountains.
Klickitat County was created out of Walla Walla County in 1859 and derives its name from the Klickitat tribe.
Washington has 12 regional Workforce Development Areas. Klickitat County is part of Area 9, the South-Central Workforce Development Area. Visit the Workforce Training & Education Coordinating Board website for information about the workforce regions.
Klickitat County employment situation for August 2025
Monthly labor force and unemployment
-
As of August 2025, Klickitat County total labor force, employment and unemployment decreased since August 2024.
-
Klickitat County has more than 9,563 people in the labor force, with a decrease of 0.8% or 81 workers from August 2024, with employed workforce decreasing by 0.8% or 72 workers and unemployed workers decreased by 1.9% or 9 workers. About 459 people were unemployed and looking for work.
-
The unemployment rate in the county was 4.8% in August 2025, which increased from 4.6% in July 2025 and unemployment rate decreased from 4.9% in August 2024.
Unemployment rate, not seasonally adjusted
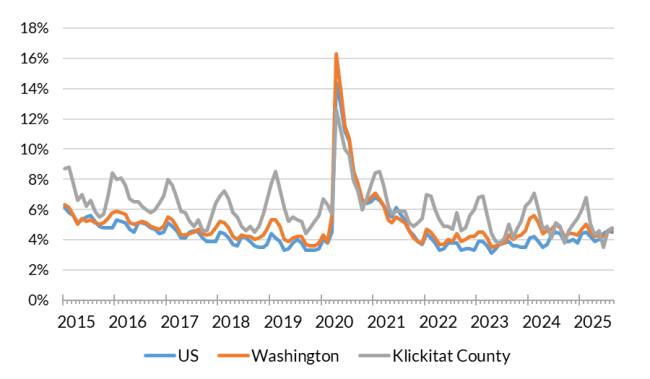
Source: Employment Security Department/Labor Market Information and Research Division, Local area unemployment statistics
Monthly payroll employment in Klickitat County
-
Overall job trends show that Klickitat County experienced a decline in job growth, losing 20 jobs, a 0.3% decrease compared to August 2024, with total payroll employment of 6,280. The private sector contracted by 90 jobs, or 2.0%, while government employment increased by 4.0%, adding 70 jobs year-over-year.
-
Since August 2024, industries with growth include manufacturing, which increased by 50 jobs or 4.7% year-over-year, the construction industry, which increased by 10 jobs or 3.3% and private education and health services, which increased by 10 jobs or 2.2%.
-
Industries facing declines include the other services industry cluster, which decreased by 30 jobs each (7.5%), professional and business services, which fell by 8.1%, losing 60 jobs, financial and information activities industries, which fell by 10 jobs each (6.7% and 6.7%), respectfully. Transportation, warehousing and utilities decreased by 10 jobs (4.3%) and retail trade decreased by 30 jobs or (6.5%).
-
Government employment increased by 4.0%, adding 70 jobs, with federal government positions remained unchanged. State government decreased by 10 jobs or 5.0%, while local government saw the most notable growth, increasing by 6.3%, adding 90 jobs.
Nonfarm employment estimates, not seasonally adjusted, Klickitat County
| NAICS Industry Title | Aug 2025 (Prelim) | Jul 2025 (Revised) | Aug 2024 (Revised) | Jul 2025 to Aug 2025 Change | Aug 2024 to Aug 2025 Change | Aug 2024 to Aug 2025 % Change |
|---|---|---|---|---|---|---|
| Total nonfarm | 6,280 | 6,240 | 6,300 | 40 | -20 | -0.3% |
| Total private (total nonfarm less government) | 4,450 | 4,420 | 4,540 | 30 | -90 | -2.0% |
| Goods-producing | 1,470 | 1,440 | 1,420 | 30 | 50 | 3.5% |
| - Mining and logging | 40 | 40 | 60 | 0 | -20 | -33.3% |
| - Construction | 310 | 300 | 300 | 10 | 10 | 3.3% |
| - Manufacturing | 1,110 | 1,100 | 1,060 | 10 | 50 | 4.7% |
| Service-providing | 4,820 | 4,800 | 4,880 | 20 | -60 | -1.2% |
| - Wholesale trade | 120 | 110 | 120 | 10 | 0 | 0.0% |
| - Retail trade | 430 | 430 | 460 | 0 | -30 | -6.5% |
| - Transportation, warehousing, and utilities | 220 | 220 | 230 | 0 | -10 | -4.3% |
| - Information | 50 | 50 | 60 | 0 | -10 | -16.7% |
| - Financial activities | 140 | 140 | 150 | 0 | -10 | -6.7% |
| - Professional and business services | 680 | 690 | 740 | -10 | -60 | -8.1% |
| - Private education and health services | 470 | 470 | 460 | 0 | 10 | 2.2% |
| - Leisure and hospitality | 500 | 500 | 500 | 0 | 0 | 0.0% |
| - Other services | 370 | 360 | 400 | 10 | -30 | -7.5% |
| - Government | 1,830 | 1,830 | 1,760 | 0 | 70 | 4.0% |
Note: Data benchmarked through March 2025, updated September 15, 2025.
Source: Employment Security Department/Labor Market Information and Research Division, Washington employment estimates (WA-QB & CES)
Detailed tables can be found on the source page in the third spreadsheet titled Current employment estimates, not seasonally adjusted.
Total covered employment in Klickitat County
In 2024, Klickitat County’s total covered employment reflected a dynamic and varied economic landscape. The county’s total payroll wages paid reached $467.45 million, with an average annual employment at over7,200 and an average annual wage of $64,900.
The government sector led in employment, accounting for 1,776 jobs or 24.7% of the county’s workforce. Agriculture followed with 1,231 jobs (17.1%), while manufacturing contributed 1,058 jobs (14.7%), underscoring the county’s strong ties to both public service and production industries.
Retail trade with 444 jobs, health care and social assistance (389 jobs), and accommodation and food services (375 jobs) also played notable roles in the employment landscape, though these sectors tended to offer lower average wages.
In terms of earnings, the professional, scientific, and technical services sector stood out with the highest average annual wage at $170,579, followed by utilities ($146,304) and information services ($117,885). Manufacturing offered competitive wages at $82,640, while other services (excluding public administration) and wholesale trade provided average wages of $76,974 and $71,900, respectively.
Employment by industry, Klickitat County 2024 annual average
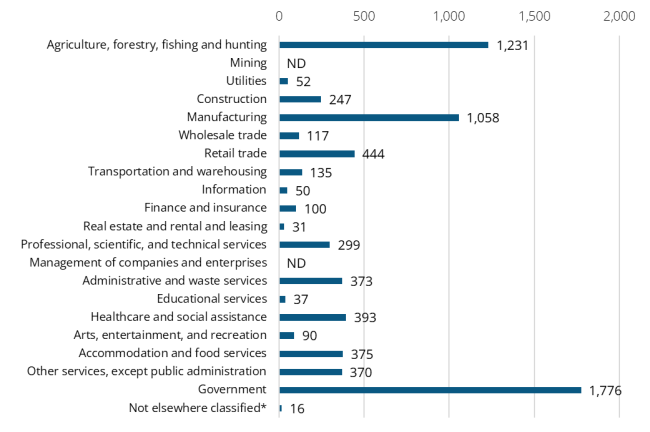
Source: Employment Security Department/Labor Market Information and Research Division, Covered Employment (QCEW)
Top sectors in terms of employment in 2024:
-
Government (1,776 jobs or 24.7% employment share)
-
Agriculture (1,231 jobs or 17.1% employment share)
-
Manufacturing (1,058 jobs or 14.7% employment share)
-
Retail trade (444 jobs or 6.2% employment share)
-
Health care and social assistance (389 jobs or 5.5% employment share)
-
Accommodation and food services (375 jobs or 5.2% employment share)
Wages can vary substantially from one industry sector to another. The 2024 average annual wage in Klickitat County for all industries was $64,978. Total annual payroll was $467.45 million.
Top sectors in terms of wages in 2024:
-
Professional, scientific and technical services ($170,579)
-
Utilities ($146,304)
-
Information ($117,885)
-
Manufacturing ($82,640)
-
Other services, except public administration ($76,974)
-
Wholesale trade ($71,900)
Workforce demographics in Klickitat County
The labor force participation rate is highest among the 20-24 age group at 82.1%, while the 65-74 age group has the lowest at 22.2%. Participation rate for prime working population 20 to 64 years of age was 72.3%.
Male workers have a slightly higher participation rate (77.9%) compared to female workers (66.4%). People with a bachelor’s degree or higher have the highest participation rate at 75.1%, while those with a high school diploma have the lowest at 72.2%.
Visit the U.S. Census Bureau website for quick facts about Klickitat County.
Age
| Demographic characteristic | Total | Labor force participation rate | Unemployment rate |
|---|---|---|---|
| Population 16 years and over | 19,418 | 54.3% | 1.6% |
| 16 to 19 years | 797 | 23.8% | 1.0% |
| 20 to 24 years | 1,198 | 82.1% | 9.4% |
| 25 to 29 years | 1,176 | 79.9% | 12.3% |
| 30 to 34 years | 1,307 | 67.7% | 4.3% |
| 35 to 44 years | 2,878 | 75.4% | 3.2% |
| 45 to 54 years | 2,791 | 78.6% | 2.0% |
| 55 to 59 years | 1,594 | 77.4% | 11.9% |
| 60 to 64 years | 1,929 | 46.7% | 0.0% |
| 65 to 74 years | 3,679 | 22.2% | 0.0% |
| 75 years and over | 2,069 | 10.6% | 37.5% |
Race or Hispanic origin
| Demographic characteristic | Total | Labor force participation rate | Unemployment rate |
|---|---|---|---|
| White alone | 16,674 | 52.0% | 4.8% |
| Black or African American alone | 117 | 79.5% | 20.4% |
| American Indian and Alaska Native alone | 224 | 38.4% | 55.8% |
| Asian alone | 191 | 34.6% | 0.0% |
| Native Hawaiian and other Pacific Islander alone | 82 | 35.4% | 0.0% |
| Some other race alone | 764 | 87.7% | 0.0% |
| Two or more races | 1,366 | 67.7% | 2.3% |
| Hispanic or Latino origin (of any race) | 2,184 | 78.4% | 7.1% |
| White alone, not Hispanic or Latino | 15,755 | 50.8% | 3.9% |
| Population 20 to 64 years | 12,873 | 72.3% | 5.4% |
Sex
| Demographic characteristic | Total | Labor force participation rate | Unemployment rate |
|---|---|---|---|
| Male | 6,603 | 77.9% | 5.1% |
| Female | 6,270 | 66.4% | 5.8% |
Females with children
| Demographic characteristic | Total | Labor force participation rate | Unemployment rate |
|---|---|---|---|
| With own children under 18 | 1,840 | 60.3% | 8.5% |
| With own children under 6 only | 499 | 56.7% | 0.0% |
| With own children under 6 and 6 to 17 | 324 | 62.7% | 28.1% |
| With own children 6 to 17 only | 1,017 | 61.3% | 5.9% |
Poverty status in the past 12 months
| Demographic characteristic | Total | Labor force participation rate | Unemployment rate |
|---|---|---|---|
| Below poverty level | 1,945 | 42.7% | 34.1% |
| At or above the poverty level | 10,904 | 77.8% | 2.6% |
Disability status
| Demographic characteristic | Total | Labor force participation rate | Unemployment rate |
|---|---|---|---|
| With any disability | 1,827 | 49.1% | 8.6% |
Educational attainment
| Demographic characteristic | Total | Labor force participation rate | Unemployment rate |
|---|---|---|---|
| Population 25 to 64 years | 11,675 | 71.3% | 5.9% |
| Less than high school graduate | 1,293 | 72.2% | 7.9% |
| High school graduate (includes equivalency) | 3,091 | 69.4% | 12.8% |
| Some college or associate's degree | 3,426 | 68.4% | 5.0% |
| Bachelor's degree or higher | 3,865 | 75.1% | 1.0% |
Source: U.S. Census Bureau, American Community Survey 5-year estimates, S2301 | Employment Status
This workforce product was funded by a grant awarded by the U.S. Department of Labor's Employment and Training Administration. The product was created by the recipient and does not necessarily reflect the official position of the U.S. Department of Labor. The Department of Labor makes no guarantees, warranties, or assurances of any kind, expressed or implied, with respect to such information, including any information on linked sites and including, but not limited to, accuracy of the information or its completeness, timeliness, usefulness, adequacy, continued availability, or ownership. This product is copyrighted by the institution that created it. Internal use by an organization and/or personal use by an individual for non-commercial purposes is permissible. All other uses require the prior authorization of the copyright owner.