

August 2025 highlights
The unemployment rate in the county was 5.5% in August 2025, which increased from 5.4% in July 2025 and unemployment rate decreased from 6.0% in August 2024. Overall job trends show that Yakima County experienced decrease by 400 jobs or 0.4% compared to August 2024, with total employment at 89,100.
Summary
Yakima County’s economy is firing on all cylinders. Agriculture continues to be the heart of it all — with more than 29,000 jobs in 2024 and $1.16 billion in wages, it’s not just a sector, it’s a way of life. Apples, hops, dairy and wine grapes keep the region on the map, and the ripple effects through food processing and distribution are massive. With 2,523 farms working across 1.8 million acres and generating $2.3 billion in annual sales, it’s no wonder agriculture accounts for a quarter of all employment.
But it’s not just farms and fields. Health care and government are right up there too, each employing more than 18,000 people. Government jobs saw a bump of 700 positions from the previous year, and health care continues to provide stability and solid wages — averaging nearly $60,000 annually. Manufacturing is holding strong with nearly 8,000 jobs, and retail trade, while lower in wages, still supports more than 11,000 workers.
The average annual wage across all industries rose to $52,105 in 2024, and the county’s total payroll topped $6 billion. That’s a big leap from previous years and shows how Yakima is growing not just in jobs, but in earning power.
Workforce development is keeping pace, with targeted training in agriculture, food processing and trade-related industries. There’s also a push to diversify — supporting agribusiness innovation, boosting tourism around wineries and outdoor recreation, and helping small businesses thrive through entrepreneurial programs.
As of August 2025, the labor market remains active. Seasonal shifts tied to agriculture still influence employment patterns, but the overall picture is one of resilience and steady growth. With nearly 190,000 residents aged 16 and older and more than 5,800 establishments, Yakima County is positioned for continued momentum.
Geography
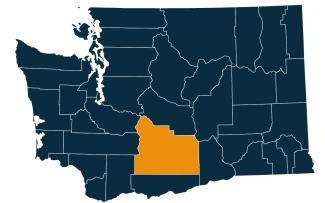
Yakima is the second largest county in Washington state at 2.75 million acres. Three entities own or manage 63.4% of the land:
- The Yakama Nation (1,074,174 acres)
- The U.S. Forest Service (503,726 acres)
- The U.S. Army Yakima Training Center (165,787 acres)
Employment situation for August 2025
Labor force and unemployment
-
As of August 2025, Yakima County total labor force, employment and unemployment decreased since August 2024.
-
Yakima County has more than 126,399 people in the labor force, with a decrease of 1.4% or 1,750 workers from August 2024, while employed workforce decreased by 0.8% or 1,002 workers and unemployed workers decreased by 9.6% or 748 workers. About 6,915 people were unemployed and looking for work.
-
The unemployment rate in the county was 5.5% in August 2025, which increased from 5.4% in July 2025 and unemployment rate decreased from 6.0% in August 2024.
Unemployment rate, not seasonally adjusted
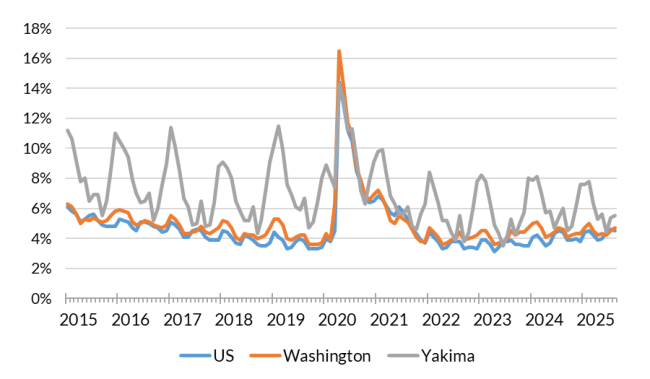
Source: Employment Security Department/Labor Market Information and Research Division, Local area unemployment statistics
Payroll employment
-
Overall job trends show that Yakima County experienced decrease by 400 jobs or 0.4% compared to August 2024, with total employment at 89,100. The private sector expended 600 jobs or 0.8%, while government employment declined by 5.6%, shedding 1,000 jobs.
-
Industries with growth include private education and health services, which rose by 4.5%, gaining 900 jobs. Retail trade increased by 2.7%, gaining 300 jobs.
-
Industries facing declines include professional and business services which fell 10.9%, shedding 600 jobs, followed by manufacturing with a decrease of 2.5% or 200 jobs and wholesale trade with a decrease of 4.4% or 200 jobs, year-over-year.
-
Government employment declined by 5.6%, losing 1,000 jobs, driven by a 6.4% drop in local government and a 3.8% drop in state government, while federal employment remained unchanged.
Nonfarm employment estimates, not seasonally adjusted, Yakima County
| NAICS Industry Title | Aug 2025 (Prelim) | Jul 2025 (Revised) | Aug 2024 (Revised) | Jul 2025 to Aug 2025 Change | Aug 2024 to Aug 2025 Change | Aug 2024 to Aug 2025 % Change |
|---|---|---|---|---|---|---|
| Total nonfarm | 89,100 | 90,100 | 89,500 | -1,000 | -400 | -0.4% |
| Total private (total nonfarm less government) | 72,100 | 72,400 | 71,500 | -300 | 600 | 0.8% |
| Goods-producing | 12,100 | 12,200 | 12,300 | -100 | -200 | -1.6% |
| - Mining, logging and construction | 4,400 | 4,400 | 4,400 | 0 | 0 | 0.0% |
| - Manufacturing | 7,700 | 7,800 | 7,900 | -100 | -200 | -2.5% |
| Service-providing | 77,000 | 77,900 | 77,200 | -900 | -200 | -0.3% |
| - Wholesale trade | 4,300 | 4,400 | 4,500 | -100 | -200 | -4.4% |
| - Retail trade | 11,500 | 11,500 | 11,200 | 0 | 300 | 2.7% |
| - Transportation, warehousing, and utilities | 3,800 | 3,900 | 3,800 | -100 | 0 | 0.0% |
| - Professional and business services | 4,900 | 4,900 | 5,500 | 0 | -600 | -10.9% |
| - Private education and health services | 20,700 | 20,700 | 19,800 | 0 | 900 | 4.5% |
| - Leisure and hospitality | 8,800 | 8,900 | 8,800 | -100 | 0 | 0.0% |
| - Government | 17,000 | 17,700 | 18,000 | -700 | -1,000 | -5.6% |
Note: Data benchmarked through March 2025, updated September 15, 2025.
Source: Employment Security Department/Labor Market Information and Research Division, Washington employment estimates (WA-QB & CES)
Detailed tables can be found on the source page in the third spreadsheet titled Current employment estimates, not seasonally adjusted.
Industry employment (covered employment)
Employment by industry, Yakima County 2024 annual average
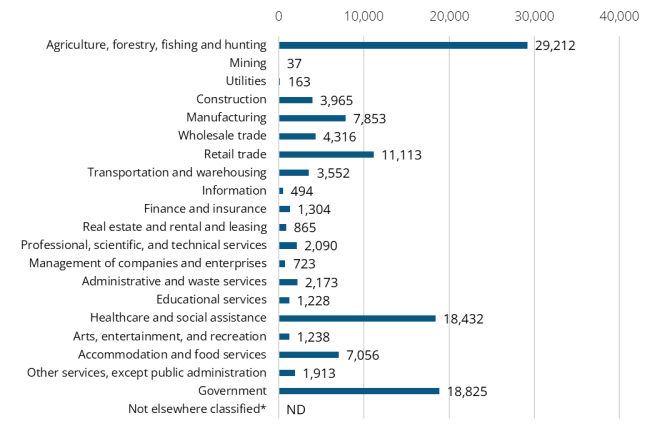
Source: Employment Security Department/Labor Market Information and Research Division, Covered Employment (QCEW)
Covered employment, or Quarterly Census of Employment and Wage (QCEW) data, include agricultural and nonagricultural employment and wages for firms, organizations and individuals whose employees are covered by the Washington State Employment Security Act. Average annual covered employment in 2024 in Yakima County was 116,553, with the average annual wage was $52,105.
Top sectors in terms of employment in 2024:
-
Agriculture, forestry and fishing (29,212 jobs or 25.1% employment share)
-
Government (18,825 jobs or 16.2% employment share)
-
Health care and social assistance (18,432 jobs or 15.8% employment share)
-
Retail trade (11,113 jobs or 9.5% employment share)
-
Manufacturing (7,853 jobs or 6.7% employment share)
-
Accommodations and food services (7,056 jobs or 6.1% employment share)
Top sectors in terms of total wages paid in 2024:
-
Mining ($131,090)
-
Utilities ($121,313)
-
Management of companies and enterprises ($96,320)
-
Finance and insurance ($84,879)
-
Wholesale trade ($74,237)
-
Professional, scientific and technical services ($68,244)
-
Government ($66,089)
Workforce demographics in Yakima County
Yakima County’s 16 and older population was 189,087 in 2023. The labor force participation rate was 62.1%. The average unemployment rate was 7.2%.
Visit the U.S. Census Bureau website for more quick facts about Yakima County.
Age
| Demographic characteristic | Total | Labor force participation rate | Unemployment rate |
|---|---|---|---|
| Population 16 years and over | 189,744 | 62.6% | 7.1% |
| 16 to 19 years | 15,556 | 38.3% | 20.6% |
| 20 to 24 years | 17,088 | 74.9% | 12.1% |
| 25 to 29 years | 17,719 | 81.9% | 7.9% |
| 30 to 34 years | 16,943 | 78.1% | 7.0% |
| 35 to 44 years | 31,019 | 83.3% | 3.9% |
| 45 to 54 years | 27,508 | 79.7% | 5.5% |
| 55 to 59 years | 13,716 | 72.2% | 5.5% |
| 60 to 64 years | 13,573 | 60.2% | 2.9% |
| 65 to 74 years | 21,789 | 25.3% | 8.9% |
| 75 years and over | 14,833 | 5.9% | 10.3% |
Race or Hispanic origin
| Demographic characteristic | Total | Labor force participation rate | Unemployment rate |
|---|---|---|---|
| White alone | 107,143 | 57.9% | 4.4% |
| Black or African American alone | 1,629 | 61.6% | 6.6% |
| American Indian and Alaska Native alone | 6,240 | 52.0% | 11.0% |
| Asian alone | 2,526 | 60.8% | 0.9% |
| Native Hawaiian and other Pacific Islander alone | 705 | 67.9% | 0.0% |
| Some other race alone | 33,722 | 70.3% | 11.4% |
| Two or more races | 37,779 | 70.7% | 9.5% |
| Hispanic or Latino origin (of any race) | 86,926 | 70.7% | 9.4% |
| White alone, not Hispanic or Latino | 87,055 | 55.4% | 4.1% |
| Population 20 to 64 years | 137,566 | 77.3% | 6.2% |
Sex
| Demographic characteristic | Total | Labor force participation rate | Unemployment rate |
|---|---|---|---|
| Male | 69,542 | 82.1% | 5.4% |
| Female | 68,024 | 72.5% | 7.1% |
Females with children
| Demographic characteristic | Total | Labor force participation rate | Unemployment rate |
|---|---|---|---|
| With own children under 18 | 27,414 | 74.1% | 7.3% |
| With own children under 6 only | 5,012 | 72.0% | 8.1% |
| With own children under 6 and 6 to 17 | 7,968 | 69.8% | 6.9% |
| With own children 6 to 17 only | 14,434 | 77.3% | 7.2% |
Poverty status in the past 12 months
| Demographic characteristic | Total | Labor force participation rate | Unemployment rate |
|---|---|---|---|
| Below poverty level | 18,008 | 44.8% | 20.3% |
| At or above the poverty level | 118,378 | 83.0% | 5.1% |
Disability status
| Demographic characteristic | Total | Labor force participation rate | Unemployment rate |
|---|---|---|---|
| With any disability | 16,780 | 39.3% | 9.5% |
Educational attainment
| Demographic characteristic | Total | Labor force participation rate | Unemployment rate |
|---|---|---|---|
| Population 25 to 64 years | 120,478 | 77.7% | 5.4% |
| Less than high school graduate | 29,311 | 71.8% | 8.4% |
| High school graduate (includes equivalency) | 36,171 | 75.7% | 5.7% |
| Some college or associate's degree | 32,854 | 77.8% | 5.6% |
| Bachelor's degree or higher | 22,142 | 88.4% | 1.6% |
Source: U.S. Census Bureau, American Community Survey 5-year estimates, S2301 | Employment Status
This workforce product was funded by a grant awarded by the U.S. Department of Labor's Employment and Training Administration. The product was created by the recipient and does not necessarily reflect the official position of the U.S. Department of Labor. The Department of Labor makes no guarantees, warranties, or assurances of any kind, expressed or implied, with respect to such information, including any information on linked sites and including, but not limited to, accuracy of the information or its completeness, timeliness, usefulness, adequacy, continued availability, or ownership. This product is copyrighted by the institution that created it. Internal use by an organization and/or personal use by an individual for non-commercial purposes is permissible. All other uses require the prior authorization of the copyright owner.