

August 2025 highlights
In August, the not seasonally adjusted monthly unemployment rate remained unchanged at 4.4%. Total nonfarm employment increased by 100 jobs in Okanogan County from August 2024.
Summary
Okanogan County’s labor supply is 19,462 workers with a not seasonally adjusted unemployment rate of 4.4%. Total nonfarm employment during August 2025 was 14,240 jobs, an increase of 100 jobs from August 2024 but a decrease of 50 jobs over the month. The government sector makes up the largest industry with an annual average employment of 5,144 jobs out of 17,048 total annual average employment in 2024. The county has 1,477 establishments employing workers covered by the Washington State Employment Security Act. The population of people ages 16-and-above is 34,281. Okanogan County had an estimated population of 44,942 in 2024, according to the census, an increase of 6.8% since 2020.
Geography
Okanogan County is in north Washington on the Canadian border east of the midline of the state. The county is the largest of Washington’s counties by land area.
Employment situation for August 2025
Labor force and unemployment
- The not seasonally adjusted unemployment rate was 4.4% during August 2025, down from 4.5% in August 2024.
- The labor force decreased by 264 workers from August 2024 to August 2025.
- The total employed workers decreased by 235 workers from August 2024 to August 2025.
Unemployment rate, not seasonally adjusted
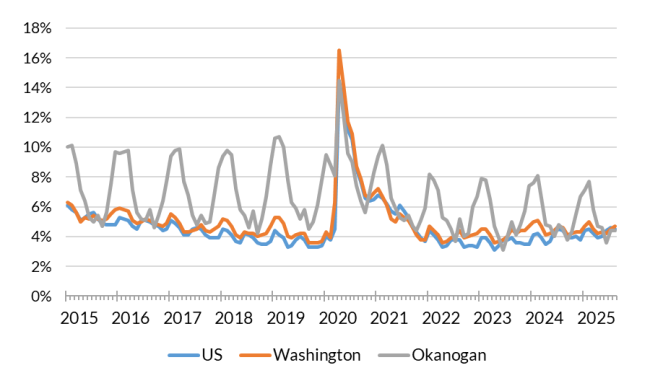
Source: Employment Security Department/Labor Market Information and Research Division, Local area unemployment statistics
Payroll employment
- Total nonfarm employment during August 2025 was 14,240 jobs, an increase of 100 jobs from August 2024 but a decrease of 50 jobs over the month.
- Construction decreased by 50 jobs from August 2024 to August 2025 but increased by 10 jobs over the month.
- Manufacturing increased by 10 jobs from August 2024 to August 2025 and increased by 20 jobs over the month.
- Retail trade decreased by 110 jobs from August 2024 and decreased by 50 jobs over the month.
- Leisure and hospitality increased by 100 jobs from August 2024 and increased by 40 jobs over the month.
- Health care and social assistance increased by 100 jobs from August 2024 and increased by 20 jobs over the month.
- Government jobs increased by 140 jobs from August 2024 but decreased by 70 jobs over the month.
Nonfarm employment estimates, not seasonally adjusted, Okanogan County
| NAICS Industry Title | Aug 2025 (Prelim) | Jul 2025 (Revised) | Aug 2024 (Revised) | Jul 2025 to Aug 2025 Change | Aug 2024 to Aug 2025 Change | Aug 2024 to Aug 2025 % Change |
|---|---|---|---|---|---|---|
| Total nonfarm | 14,240 | 14,290 | 14,140 | -50 | 100 | 0.7% |
| Total private (total nonfarm less government) | 8,840 | 8,820 | 8,880 | 20 | -40 | -0.5% |
| Goods-producing | 1,380 | 1,350 | 1,480 | 30 | -100 | -6.8% |
| - Mining and logging | 80 | 80 | 140 | 0 | -60 | -42.9% |
| - Construction | 540 | 530 | 590 | 10 | -50 | -8.5% |
| - Manufacturing | 760 | 740 | 750 | 20 | 10 | 1.3% |
| Service-providing | 12,860 | 12,940 | 12,660 | -80 | 200 | 1.6% |
| - Wholesale trade | 190 | 190 | 210 | 0 | -20 | -9.5% |
| - Retail trade | 2,070 | 2,120 | 2,180 | -50 | -110 | -5.0% |
| - Transportation, warehousing, and utilities | 240 | 240 | 240 | 0 | 0 | 0.0% |
| - Information | 120 | 130 | 120 | -10 | 0 | 0.0% |
| - Financial activities | 280 | 270 | 270 | 10 | 10 | 3.7% |
| - Professional and business services | 700 | 720 | 700 | -20 | 0 | 0.0% |
| - Private education and health services | 1,880 | 1,850 | 1,780 | 30 | 100 | 5.6% |
| - Leisure and hospitality | 1,640 | 1,600 | 1,540 | 40 | 100 | 6.5% |
| - Other services | 340 | 350 | 350 | -10 | -10 | -2.9% |
| - Government | 5,400 | 5,470 | 5,260 | -70 | 140 | 2.7% |
Note: Data benchmarked through March 2025, updated September 15, 2025.
Source: Employment Security Department/Labor Market Information and Research Division, Washington employment estimates (WA-QB & CES)
Detailed tables can be found on the source page in the third spreadsheet titled Current employment estimates, not seasonally adjusted.
Industry employment (covered employment)
Employment by industry, Okanogan County 2024 annual average
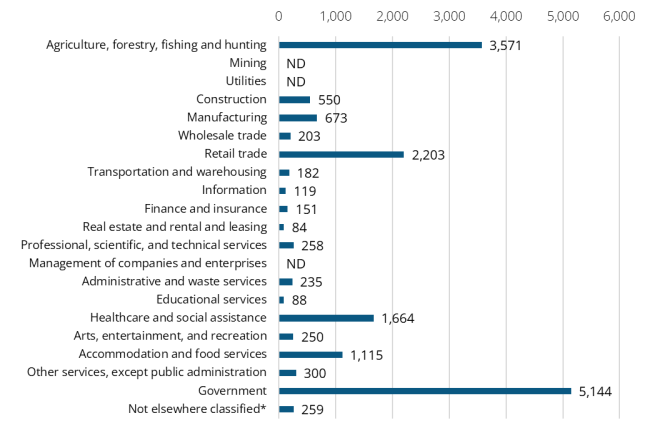
Source: Employment Security Department/Labor Market Information and Research Division, Covered Employment (QCEW)
Covered employment, or Quarterly Census of Employment and Wage (QCEW) data, include agricultural and nonagricultural employment and wages for firms, organizations and individuals whose employees are covered by the Washington State Employment Security Act. Covered employment generally exceeds 85% of total employment in the state of Washington. Average annual covered employment in 2024 in Okanogan County was 17,048. The average annual wage was $48,515, which was 52.5% of Washington state’s average annual wage of $92,467.
Top sectors by total employment in 2024:
- Government (5,144 jobs)
- Agriculture, forestry and fishing and hunting (3,571 jobs)
- Retail trade (2,203 jobs)
- Health care and social assistance (1,664 jobs)
- Accommodation and food services (1,115 jobs)
Top sectors by total wages paid in 2024:
- Government ($341.7 million)
- Agriculture, forestry and fishing and hunting ($ 122.2 million)
- Health care and social assistance ($86.1 million)
- Retail trade ($80.6 million)
- Accommodation and food services ($30.2 million)
Workforce demographics in Okanogan County
Okanogan County’s 16 and older population was 34,281 in 2023. The labor force participation rate was 56.3% with an average unemployment rate of 4.8%.
Visit the U.S. Census Bureau website for more quick facts about Okanogan County.
Age
| Demographic characteristic | Total | Labor force participation rate | Unemployment rate |
|---|---|---|---|
| Population 16 years and over | 34,281 | 56.3% | 4.8% |
| 16 to 19 years | 1,644 | 38.9% | 16.4% |
| 20 to 24 years | 2,017 | 81.0% | 7.7% |
| 25 to 29 years | 2,613 | 77.8% | 4.4% |
| 30 to 34 years | 2,370 | 73.8% | 6.9% |
| 35 to 44 years | 4,964 | 83.7% | 4.4% |
| 45 to 54 years | 4,839 | 82.9% | 3.6% |
| 55 to 59 years | 2,742 | 65.9% | 2.2% |
| 60 to 64 years | 3,275 | 47.6% | 5.6% |
| 65 to 74 years | 6,159 | 24.2% | 1.7% |
| 75 years and over | 3,658 | 6.6% | 2.5% |
Race or Hispanic origin
| Demographic characteristic | Total | Labor force participation rate | Unemployment rate |
|---|---|---|---|
| White alone | 24,012 | 51.1% | 3.5% |
| Black or African American alone | 693 | 88.0% | 1.5% |
| American Indian and Alaska Native alone | 2,800 | 58.3% | 8.0% |
| Asian alone | 181 | 58.0% | 13.3% |
| Native Hawaiian and other Pacific Islander alone | 43 | 100.0% | 0.0% |
| Some other race alone | 2,988 | 78.8% | 8.8% |
| Two or more races | 3,564 | 64.7% | 6.1% |
| Hispanic or Latino origin (of any race) | 5,594 | 75.4% | 5.5% |
| White alone, not Hispanic or Latino | 23,381 | 51.1% | 3.5% |
| Population 20 to 64 years | 22,820 | 74.3% | 4.7% |
Sex
| Demographic characteristic | Total | Labor force participation rate | Unemployment rate |
|---|---|---|---|
| Male | 11,743 | 80.7% | 5.7% |
| Female | 11,077 | 67.5% | 3.3% |
Females with children
| Demographic characteristic | Total | Labor force participation rate | Unemployment rate |
|---|---|---|---|
| With own children under 18 | 4,204 | 67.3% | 3.8% |
| With own children under 6 only | 780 | 52.2% | 8.8% |
| With own children under 6 and 6 to 17 | 1,026 | 48.4% | 1.2% |
| With own children 6 to 17 only | 2,398 | 80.3% | 3.4% |
Poverty status in the past 12 months
| Demographic characteristic | Total | Labor force participation rate | Unemployment rate |
|---|---|---|---|
| Below poverty level | 4,224 | 53.2% | 12.3% |
| At or above the poverty level | 18,455 | 79.6% | 3.5% |
Disability status
| Demographic characteristic | Total | Labor force participation rate | Unemployment rate |
|---|---|---|---|
| With any disability | 3,111 | 43.0% | 15.8% |
Educational attainment
| Demographic characteristic | Total | Labor force participation rate | Unemployment rate |
|---|---|---|---|
| Population 25 to 64 years | 20,803 | 73.6% | 4.3% |
| Less than high school graduate | 3,338 | 69.9% | 5.5% |
| High school graduate (includes equivalency) | 6,336 | 71.2% | 5.1% |
| Some college or associate's degree | 6,665 | 73.2% | 4.6% |
| Bachelor's degree or higher | 4,464 | 80.3% | 2.3% |
Source: U.S. Census Bureau, American Community Survey 5-year estimates, S2301 | Employment Status
This workforce product was funded by a grant awarded by the U.S. Department of Labor's Employment and Training Administration. The product was created by the recipient and does not necessarily reflect the official position of the U.S. Department of Labor. The Department of Labor makes no guarantees, warranties, or assurances of any kind, expressed or implied, with respect to such information, including any information on linked sites and including, but not limited to, accuracy of the information or its completeness, timeliness, usefulness, adequacy, continued availability, or ownership. This product is copyrighted by the institution that created it. Internal use by an organization and/or personal use by an individual for non-commercial purposes is permissible. All other uses require the prior authorization of the copyright owner.