

- Posted October 2025
August 2025 highlights
Since July, the not seasonally adjusted unemployment rate increased from 4.5% to 4.8%, and total nonfarm employment increased by 10 jobs.
Summary
The not seasonally adjusted unemployment rate was 4.8% in August 2025, up from 4.5% last month and below last year’s 5.1%. The Jefferson County labor force has 12,589 workers. There were approximately 41 initial claim filings for unemployment insurance over the month. Total nonfarm employment, at 9,270 jobs, decreased by 150 jobs from August 2024 to August 2025, and increased by 10 jobs from July 2025.
Geography
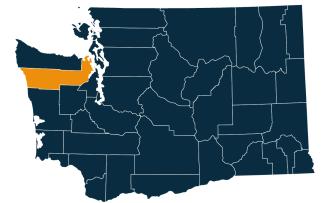
Jefferson County is located on the Olympic Peninsula in northwestern Washington state. It is nestled between the Admiralty Inlet and Clallam, Mason, Grays Harbor and Kitsap counties. It faces the Pacific Ocean to the west and Hood Canal to the east. Named for President Thomas Jefferson, it was created in 1852 from a portion of Lewis County. The county seat is Port Townsend.
Much of Jefferson County is publicly managed. About 60% of the county comprises the Olympic National Park and Olympic National Forest and roughly 20% percent is under state and federal jurisdiction. The Hoh Reservation and a small corner of the Quinault Reservation are also located in Jefferson County. Jefferson County is a mid-sized county, ranking 18th in the state in land area. Its population density, as measured by people per square mile, ranks 29th.
Jefferson County is part of the Olympic Workforce Development Area. Visit the Workforce Training & Education Coordinating Board website for information about the 12 regions
Employment situation for August 2025
Labor force and unemployment
- The not seasonally adjusted unemployment rate was 4.8% in August 2025, up from 4.5% in July 2025 and below 5.1% in August 2024.
- The labor force, at 12,589 workers, grew by 821 workers over the month and is 395 workers above last year.
Unemployment rate, not seasonally adjusted
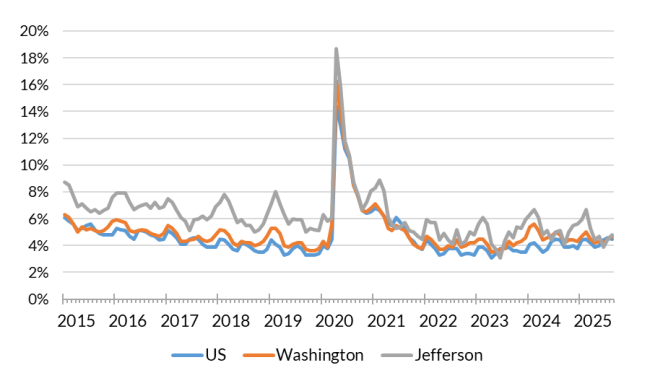
Source: Employment Security Department/Labor Market Information and Research Division, Local area unemployment statistics
Payroll employment
- Total nonfarm employment, at 9,270 jobs, increased 10 jobs from July and is lower by 150 jobs compared to August 2024.
- Construction employment, at 680 jobs, was unchanged over the month and is 40 jobs below last year.
- Retail trade employment was down 10 jobs over the month and is smaller by 70 jobs over the year.
- Private education and health services industry gained 20 jobs over the month and is 30 jobs above last year.
- Leisure and hospitality employment at 1,170 jobs was unchanged over the month and is 90 jobs below August 2024.
Nonfarm employment estimates, not seasonally adjusted, Jefferson County
| NAICS Industry Title | Aug 2025 (Prelim) | Jul 2025 (Revised) | Aug 2024 (Revised) | Jul 2025 to Aug 2025 Change | Aug 2024 to Aug 2025 Change | Aug 2024 to Aug 2025 % Change |
|---|---|---|---|---|---|---|
| Total nonfarm | 9,270 | 9,260 | 9,420 | 10 | -150 | -1.6% |
| Total private (total nonfarm less government) | 6,500 | 6,490 | 6,750 | 10 | -250 | -3.7% |
| Goods-producing | 1,360 | 1,360 | 1,410 | 0 | -50 | -3.5% |
| - Mining and logging | 20 | 20 | 20 | 0 | 0 | 0.0% |
| - Construction | 680 | 680 | 720 | 0 | -40 | -5.6% |
| - Manufacturing | 660 | 660 | 670 | 0 | -10 | -1.5% |
| Service-providing | 7,910 | 7,910 | 8,010 | 0 | -100 | -1.2% |
| - Wholesale trade | 200 | 200 | 220 | 0 | -20 | -9.1% |
| - Retail trade | 1,100 | 1,110 | 1,170 | -10 | -70 | -6.0% |
| - Transportation, warehousing, and utilities | 120 | 120 | 120 | 0 | 0 | 0.0% |
| - Information | 90 | 90 | 100 | 0 | -10 | -10.0% |
| - Financial activities | 290 | 290 | 300 | 0 | -10 | -3.3% |
| - Professional and business services | 490 | 500 | 500 | -10 | -10 | -2.0% |
| - Private education and health services | 1,160 | 1,140 | 1,130 | 20 | 30 | 2.7% |
| - Leisure and hospitality | 1,170 | 1,170 | 1,260 | 0 | -90 | -7.1% |
| - Other services | 530 | 520 | 540 | 10 | -10 | -1.9% |
| - Government | 2,770 | 2,770 | 2,680 | 0 | 90 | 3.4% |
Note: Data benchmarked through March 2025, updated September 15, 2025.
Source: Employment Security Department/Labor Market Information and Research Division, Washington employment estimates (WA-QB & CES)
Detailed tables can be found on the source page in the third spreadsheet titled Current employment estimates, not seasonally adjusted.
Industry employment (covered employment)
Employment by industry, Jefferson County 2024 annual average
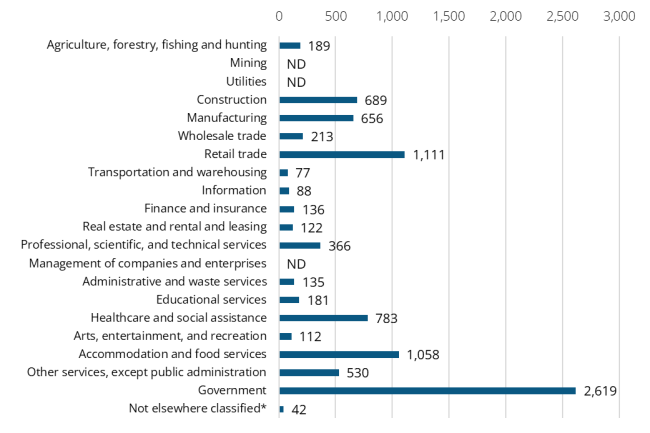
Note: ND stands for not disclosed. ND is used to avoid disclosing data for individual employers. Industries labeled ND are grouped in the Not elsewhere classified category.
Source: Employment Security Department/Labor Market Information and Research Division, Covered Employment (QCEW)
Average annual covered employment in Jefferson County was 9,107 in 2024. Covered employment refers to workers who received wages in Washington state and are eligible for state and federal unemployment insurance (UI) compensation programs.
The average annual wage in Washington state for all industries was $92,467 in 2024. The average annual wage in Jefferson County was $58,598 in 2024.
Top sectors in terms of average annual employment in 2024:
- Government (2,619)
- Retail Trade (1,111)
- Accommodation and food service (1,058)
- Health care and social services (783)
- Construction (689)
Top sectors in terms of average annual wages in 2024:
- Mining and Utilities* ($119,088)
- Professional, scientific and technical services ($98,130)
- Government ($80,828)
- Manufacturing ($75,699)
- Finance and insurance ($67,466)
Workforce demographics in Jefferson County
Age
| Demographic characteristic | Total | Labor force participation rate | Unemployment rate |
|---|---|---|---|
| Population 16 years and over | 29,896 | 43.3% | 7.7% |
| 16 to 19 years | 719 | 44.9% | 20.9% |
| 20 to 24 years | 943 | 78.3% | 25.6% |
| 25 to 29 years | 1,334 | 75.0% | 3.0% |
| 30 to 34 years | 1,570 | 77.5% | 5.8% |
| 35 to 44 years | 3,156 | 73.9% | 6.9% |
| 45 to 54 years | 3,297 | 72.1% | 8.4% |
| 55 to 59 years | 2,602 | 64.7% | 8.2% |
| 60 to 64 years | 3,094 | 46.5% | 7.6% |
| 65 to 74 years | 8,080 | 19.3% | 1.7% |
| 75 years and over | 5,101 | 5.3% | 0.0% |
Race or Hispanic origin
| Demographic characteristic | Total | Labor force participation rate | Unemployment rate |
|---|---|---|---|
| White alone | 26,198 | 43.0% | 7.7% |
| Black or African American alone | 114 | 47.4% | 0.0% |
| American Indian and Alaska Native alone | 309 | 57.9% | 15.6% |
| Asian alone | 443 | 33.9% | 0.0% |
| Native Hawaiian and other Pacific Islander alone | 29 | 75.9% | 0.0% |
| Some other race alone | 724 | 34.7% | 1.2% |
| Two or more races | 2,079 | 48.5% | 9.8% |
| Hispanic or Latino origin (of any race) | 1,077 | 58.0% | 7.6% |
| White alone, not Hispanic or Latino | 25,880 | 42.7% | 7.8% |
| Population 20 to 64 years | 15,996 | 67.4% | 8.3% |
Sex
| Demographic characteristic | Total | Labor force participation rate | Unemployment rate |
|---|---|---|---|
| Male | 7,899 | 68.5% | 9.1% |
| Female | 8,097 | 66.4% | 7.6% |
Females with children
| Demographic characteristic | Total | Labor force participation rate | Unemployment rate |
|---|---|---|---|
| With own children under 18 | 2,161 | 63.5% | 8.6% |
| With own children under 6 only | 568 | 54.0% | 6.2% |
| With own children under 6 and 6 to 17 | 419 | 40.8% | 0.0% |
| With own children 6 to 17 only | 1,174 | 76.2% | 11.1% |
Poverty status in the past 12 months
| Demographic characteristic | Total | Labor force participation rate | Unemployment rate |
|---|---|---|---|
| Below poverty level | 2,175 | 29.5% | 22.5% |
| At or above the poverty level | 13,467 | 75.3% | 7.4% |
Disability status
| Demographic characteristic | Total | Labor force participation rate | Unemployment rate |
|---|---|---|---|
| With any disability | 2,246 | 34.8% | 13.2% |
Educational attainment
| Demographic characteristic | Total | Labor force participation rate | Unemployment rate |
|---|---|---|---|
| Population 25 to 64 years | 15,053 | 66.7% | 7.1% |
| Less than high school graduate | 830 | 45.9% | 4.7% |
| High school graduate (includes equivalency) | 3,302 | 68.2% | 10.0% |
| Some college or associate's degree | 5,138 | 64.6% | 6.8% |
| Bachelor's degree or higher | 5,783 | 70.8% | 5.9% |
Source: U.S. Census Bureau, American Community Survey 5-year estimates, S2301 | Employment Status
This workforce product was funded by a grant awarded by the U.S. Department of Labor's Employment and Training Administration. The product was created by the recipient and does not necessarily reflect the official position of the U.S. Department of Labor. The Department of Labor makes no guarantees, warranties, or assurances of any kind, expressed or implied, with respect to such information, including any information on linked sites and including, but not limited to, accuracy of the information or its completeness, timeliness, usefulness, adequacy, continued availability, or ownership. This product is copyrighted by the institution that created it. Internal use by an organization and/or personal use by an individual for non-commercial purposes is permissible. All other uses require the prior authorization of the copyright owner.