

Posted October 2025
August 2025 highlights
From July to August, the not seasonally adjusted unemployment rate increased from 4.7% to 4.8% and total nonfarm employment increased by 700 jobs.
Summary
As one of the fastest growing regions of the state, Clark County has a robust and changing job market. Its largest city, Vancouver, was historically a bedroom community of neighboring Portland, Oregon. In recent years the county has developed into a major center of population and employment in southwest Washington. Clark County’s major industries include health care and social assistance, construction, manufacturing, and professional and business services.
During the COVID-19 pandemic, Clark County’s not seasonally adjusted unemployment rate peaked at 13.7% in April 2020. This was 2.8% below the statewide high of 16.5%. Since then, the county’s recovery has kept pace with statewide trends.
Location
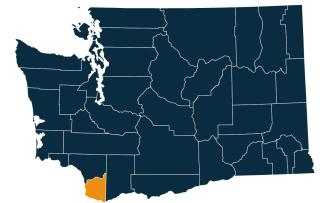
Clark County is located in southwest Washington, along the Columbia River. It is part of the Portland-Vancouver-Hillsboro, OR-WA Metropolitan Statistical Area (MSA). The region is well connected, with proximity to Interstate 5 as well as major air, rail, and maritime transportation.
Clark County, along with neighboring Cowlitz and Wahkiakum counties, is part of Washington’s seventh Workforce Development Area. Visit the Workforce Training & Education Coordinating Board website for information about the 12 regions.
Employment situation for August 2025
Labor force and unemployment
-
The not seasonally adjusted unemployment rate was 4.8% in August 2025. This was up from 4.7% in the previous month and unchanged from 4.8% in August 2024.
-
The total civilian labor force was 256,834 in August 2025, down from 257,103 in August 2024.
-
There were 12,235 unemployed persons in August 2025, 181 fewer than in August 2024.
Unemployment rate, not seasonally adjusted
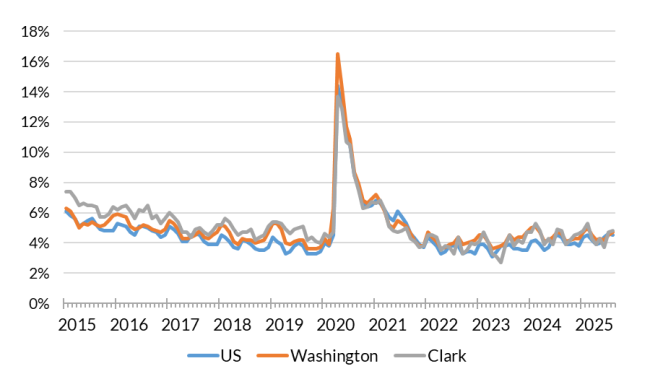
Source: Employment Security Department/Labor Market Information and Research Division, Local area unemployment statistics
Payroll employment
-
Total nonfarm employment was 190,100 in August 2025, not seasonally adjusted. This was up by 700 jobs from the previous month, and up by 2,200 jobs (1.2%) from August 2024.
-
Over the course of 12 months, ending in August 2025, employment increased in six industries, decreased in three industries, and was unchanged in four industries.
-
The largest increase over the year was in private education and health services (up 2,000 jobs), followed by professional and business services (up 600 jobs) and wholesale trade (up 500 jobs).
-
The largest decrease over the year was in construction (down 1,000 jobs), followed by leisure and hospitality (down 600 jobs) and retail trade (down 300 jobs).
Nonfarm employment estimates, not seasonally adjusted, Clark County
| NAICS Industry Title | Aug 2025 (Prelim) | Jul 2025 (Revised) | Aug 2024 (Revised) | Jul 2025 to Aug 2025 Change | Aug 2024 to Aug 2025 Change | Aug 2024 to Aug 2025 % Change |
|---|---|---|---|---|---|---|
| Total nonfarm | 190,100 | 189,400 | 187,900 | 700 | 2,200 | 1.2% |
| Total private (total nonfarm less government) | 162,100 | 161,500 | 160,400 | 600 | 1,700 | 1.1% |
| Goods-producing | 32,700 | 32,600 | 33,400 | 100 | -700 | -2.1% |
| - Mining and logging | 200 | 200 | 200 | 0 | 0 | 0.0% |
| - Construction | 18,000 | 18,000 | 19,000 | 0 | -1,000 | -5.3% |
| - Manufacturing | 14,400 | 14,400 | 14,200 | 0 | 200 | 1.4% |
| Service-providing | 157,400 | 156,800 | 154,500 | 600 | 2,900 | 1.9% |
| - Wholesale trade | 7,500 | 7,500 | 7,000 | 0 | 500 | 7.1% |
| - Retail trade | 18,400 | 18,300 | 18,700 | 100 | -300 | -1.6% |
| - Transportation, warehousing, and utilities | 4,300 | 4,300 | 4,300 | 0 | 0 | 0.0% |
| - Information | 3,700 | 3,700 | 3,700 | 0 | 0 | 0.0% |
| - Financial activities | 10,600 | 10,700 | 10,200 | -100 | 400 | 3.9% |
| - Professional and business services | 24,800 | 24,600 | 24,200 | 200 | 600 | 2.5% |
| - Private education and health services | 35,500 | 35,400 | 33,500 | 100 | 2,000 | 6.0% |
| - Leisure and hospitality | 18,300 | 18,000 | 18,900 | 300 | -600 | -3.2% |
| - Other services | 6,400 | 6,400 | 6,400 | 0 | 0 | 0.0% |
| - Government | 27,900 | 28,000 | 27,500 | -100 | 400 | 1.5% |
Note: Data benchmarked through March 2025, updated September 15, 2025.
Source: Employment Security Department/Labor Market Information and Research Division, Washington employment estimates (WA-QB & CES)
Detailed tables can be found on the source page in the third spreadsheet titled Current employment estimates, not seasonally adjusted.
Industry employment (covered employment)
Clark County has one of the most diverse economies in the state, with significant employment in both goods producing and service providing industries. Health care and social assistance continues to be a major sector with some of the largest employers in the region.
Employment by industry, Clark County 2024 annual average
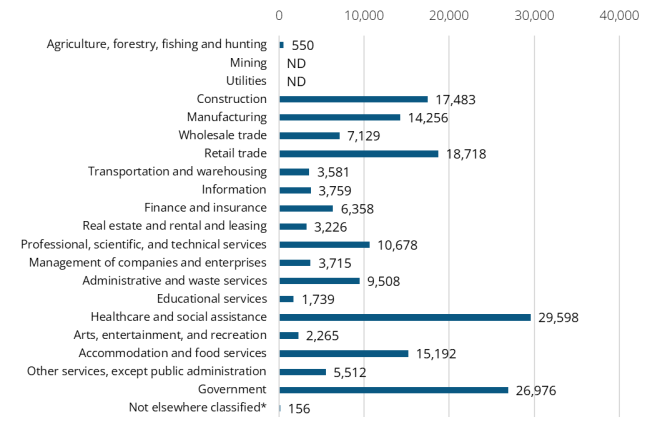
Source: Employment Security Department/Labor Market Information and Research Division, Covered Employment (QCEW)
Note: ND stands for not disclosed. ND is used to avoid disclosing data for individual employers. Industries labeled ND are grouped in the Not elsewhere classified category.
Average annual covered employment in Clark County was 180,400 in 2024. This was little changed from 180,182 in 2023. Covered employment refers to workers who received wages in Washington state and are eligible for state and federal unemployment insurance (UI) compensation programs.
Top five sectors in terms of employment in 2024:
-
Health care and social assistance (29,598)
-
Government (26,976)
-
Retail trade (18,718)
-
Construction (17,483)
-
Accommodation and food services (15,192)
Between 2023 and 2024, the average annual wage in Clark County went from $68,874 to $70,111, an increase of 1.8%.
Top five sectors in terms of wages in 2024:
-
Information ($117,848)
-
Finance and insurance ($116,508)
-
Management of companies and enterprises ($110,237)
-
Professional, scientific, and technical services ($105,531)
-
Mining and Utilities ($104,875)
Workforce demographics for Clark County
Clark County’s labor force participation rate is 64.2%, led by strong labor force participation among prime aged workers (aged 25 to 54). Approximately two-thirds of the population aged 25 to 64 has some college education or higher. Visit the U.S. Census Bureau website for quick facts about Clark County.
Age
| Demographic characteristic | Total | Labor force participation rate | Unemployment rate |
|---|---|---|---|
| Population 16 years and over | 406,229 | 64.2% | 5.2% |
| 16 to 19 years | 24,937 | 36.5% | 15.8% |
| 20 to 24 years | 29,901 | 82.0% | 7.9% |
| 25 to 29 years | 33,880 | 83.6% | 5.1% |
| 30 to 34 years | 35,748 | 83.2% | 6.1% |
| 35 to 44 years | 69,689 | 82.7% | 4.9% |
| 45 to 54 years | 65,307 | 82.6% | 3.3% |
| 55 to 59 years | 31,508 | 77.8% | 4.7% |
| 60 to 64 years | 32,247 | 59.6% | 3.9% |
| 65 to 74 years | 51,806 | 24.0% | 3.4% |
| 75 years and over | 31,206 | 5.1% | 1.8% |
Race or Hispanic origin
| Demographic characteristic | Total | Labor force participation rate | Unemployment rate |
|---|---|---|---|
| White alone | 322,881 | 63.0% | 5.3% |
| Black or African American alone | 8,391 | 69.2% | 5.0% |
| American Indian and Alaska Native alone | 2,316 | 61.7% | 5.4% |
| Asian alone | 20,541 | 67.5% | 2.7% |
| Native Hawaiian and other Pacific Islander alone | 3,087 | 71.0% | 3.4% |
| Some other race alone | 14,543 | 71.7% | 3.4% |
| Two or more races | 34,470 | 69.5% | 7.0% |
| Hispanic or Latino origin (of any race) | 40,564 | 70.4% | 6.1% |
| White alone, not Hispanic or Latino | 310,119 | 62.8% | 5.2% |
| Population 20 to 64 years | 298,280 | 79.7% | 4.9% |
Sex
| Demographic characteristic | Total | Labor force participation rate | Unemployment rate |
|---|---|---|---|
| Male | 149,553 | 86.2% | 4.8% |
| Female | 148,727 | 73.2% | 5.0% |
Females with children
| Demographic characteristic | Total | Labor force participation rate | Unemployment rate |
|---|---|---|---|
| With own children under 18 | 54,498 | 69.4% | 5.7% |
| With own children under 6 only | 12,008 | 66.8% | 6.6% |
| With own children under 6 and 6 to 17 | 11,576 | 58.4% | 14.6% |
| With own children 6 to 17 only | 30,914 | 74.5% | 2.7% |
Poverty status in the past 12 months
| Demographic characteristic | Total | Labor force participation rate | Unemployment rate |
|---|---|---|---|
| Below poverty level | 23,371 | 47.2% | 21.0% |
| At or above the poverty level | 273,693 | 82.9% | 4.1% |
Disability status
| Demographic characteristic | Total | Labor force participation rate | Unemployment rate |
|---|---|---|---|
| With any disability | 33,260 | 51.1% | 10.4% |
Educational attainment
| Demographic characteristic | Total | Labor force participation rate | Unemployment rate |
|---|---|---|---|
| Population 25 to 64 years | 268,379 | 79.5% | 4.6% |
| Less than high school graduate | 20,422 | 65.4% | 8.7% |
| High school graduate (includes equivalency) | 65,673 | 75.7% | 4.5% |
| Some college or associate's degree | 93,543 | 79.2% | 5.6% |
| Bachelor's degree or higher | 88,741 | 85.9% | 2.8% |
Source: U.S. Census Bureau, American Community Survey 5-year estimates, S2301 | Employment Status
This workforce product was funded by a grant awarded by the U.S. Department of Labor's Employment and Training Administration. The product was created by the recipient and does not necessarily reflect the official position of the U.S. Department of Labor. The Department of Labor makes no guarantees, warranties, or assurances of any kind, expressed or implied, with respect to such information, including any information on linked sites and including, but not limited to, accuracy of the information or its completeness, timeliness, usefulness, adequacy, continued availability, or ownership. This product is copyrighted by the institution that created it. Internal use by an organization and/or personal use by an individual for non-commercial purposes is permissible. All other uses require the prior authorization of the copyright owner.