Lo sentimos. Aún no hemos traducido esta página al español. Avísenos si desea que esto sea una prioridad y traduciremos la página lo antes posible.


We're sorry. We have not yet translated this page into Spanish. Please let us know if you want us to make it a priority and we will work to translate it as soon as possible.


Solicitar traducción Request translation

Gracias, su solicitud ha sido presentada. Thank you, your request has been submitted.

Chelan and Douglas County profiles

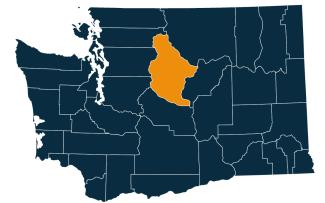
Washington state map with Chelan and Douglas counties highlightedby Don Meseck, regional labor economist - updated May 2022

Overview | Geographic facts | Outlook | Labor force and unemployment | Industry employment  | Wages and income | Population  | Useful links|  PDF Profile copy

Overview

Regional context

Chelan and Douglas counties are on the eastern edge of the Cascade Mountains and are separated by the Columbia River. Chelan and Douglas counties have a very diverse geographic area that includes mountains and lakes and flat areas next to the Columbia River. The varied terrain supports the two major industries in the area, tourism and agriculture.

The legislature created Chelan County in 1899, carving it out of Okanogan and Kittitas counties. Wenatchee is its county seat.

Douglas County is close to the geographic center of the state. Douglas County was created in 1883, named after U.S. Senator Steven Douglas of Illinois who was the chairman of the U.S. Commission on Territories when the Territory of Washington was created. Waterville is the county seat.

Chelan County ranks third in the state in land area while Douglas County ranks 17th. Both counties are sparsely populated as measured by persons per square mile.

Local economy

The first people in the area now known as Chelan and Douglas counties were tribes whose culture and economy centered on fishing, hunting and gathering. The Yakima Treaty of 1855 removed 10.8 million acres from the indigenous people’s title to the land. The result was war throughout the territory and eventual movement of tribes to the Colville Reservation. Trappers and Chinese gold prospectors were among the first non-Native Americans who lived in the area in the early 1800s. White settlers followed, beginning in the 1870s. Irrigation along with railroads spurred agricultural development in Chelan County, particularly in fruit orchards. Now grape vines are replacing some fruit orchards, driving development in wineries.

Relatively large numbers of Douglas County residents (especially from East Wenatchee) commute to work across the Columbia River into Wenatchee (in Chelan County). This commuting pattern resulted in the Bureau of Labor Statistics (BLS) designating this area as an MSA (i.e., the Wenatchee Metropolitan Statistical Area or MSA). The economy of this two-county area depends heavily upon the agriculture sector (categorized under the North American Industry Classification System as NAICS 11), as well as seasonal employment in retail and leisure and hospitality. The agricultural industry revolves around the raising, harvesting, warehousing, packing and shipping of deciduous tree fruits such as apples, cherries, pears and peaches. But the importance of the agricultural industry does not end here. The agriculture sector strongly influences many “nonfarm” industries such as nondurable goods manufacturing (i.e., food processing), wholesale trade (i.e., fresh fruit packinghouses) and transportation. Although the agriculture sector is still a pillar of the local economies of Chelan and Douglas counties, this “Number One” position is being challenged as the local economy diversifies. In 2010, Chelan County’s agricultural industry accounted for 23.5 percent of total covered employment, but this figure dipped to 21.3 percent in 2020. In 2010, Douglas County’s agricultural industry accounted for 28.1 percent of total covered employment, but this figure slipped to 22.7 percent in 2020. Hence, the structure of the Wenatchee MSA’s labor market has changed between 2010 and 2020, as follows:

  • In Chelan County, covered employment gains in the following three sectors were significant: health services (up 1,642 jobs and 34.0 percent), administrative and waste services (up 630 jobs and 109.4 percent), and construction (up 562 jobs and 44.5 percent).
  • In Douglas County covered employment gains in the following three sectors were also significant: retail trade (up 491 jobs and 36.5 percent), construction (up 243 jobs and 54.5 percent) and health services (up 210 jobs and 33.4 percent).

Tourism-related businesses (especially hotels, eating and drinking places, and amusement and recreation services) also contribute to the economy. Examples of popular attractions: Lake Chelan (the third deepest lake in the country, and a tourist “magnet” in the summer); Leavenworth (a Bavarian-themed village that hosts an Oktoberfest festival and has multiple ski resorts close to town); and the Mission Ridge and Badger Mountain Ski areas. Unfortunately, many leisure and hospitality businesses were hit hard by COVID-19-related jobs losses between 2019 and 2020:

  • In Chelan County, accommodation and food services (NAICS 72) employment plummeted by -25.3 percent (down 1,224 jobs). Arts, entertainment and recreation (NAICS 71) employment tumbled by -24.1 percent (down 145 jobs).
  • In Douglas County, accommodation and food services employment declined by -14.3 percent (down 141 jobs). Arts, entertainment and recreation employment tumbled by -27.9 percent (down 83 jobs).

On a more positive note, a May 11, 2022 article from the Wenatchee World (entitled Microsoft’s Wenatchee Valley data center begins to take shape), highlighted a development project certain to impact the local economy. The article states: “Work is well underway on a Microsoft data center and related electric substation north of Pangborn Memorial Airport.” Plans indicate that “The center could be an investment of more that $1 billion in the next several years to construct a multi-phase data center campus.”

Geographic facts

Chelan County Douglas County Washington state
 Land area, 2010 (square miles) 2,920.53  1,819.26  66,455.52 
 Persons per square mile, 2010 24.8  21.1  101.2 


Source: U.S. Census Bureau QuickFacts

(back to top)


Outlook

Official long-term (i.e., 10-year) industry employment projections produced by the Employment Security Department are for a 0.1 percent average annual nonfarm growth rate from 2019 to 2029 for the five-county (Adams, Chelan, Douglas, Grant and Okanogan) North Central Workforce Development Area (WDA), and for a 0.4 percent growth rate for Washington state.

(back to top)


Labor force and unemployment

Current labor force and unemployment statistics are available on the Labor area summaries page.

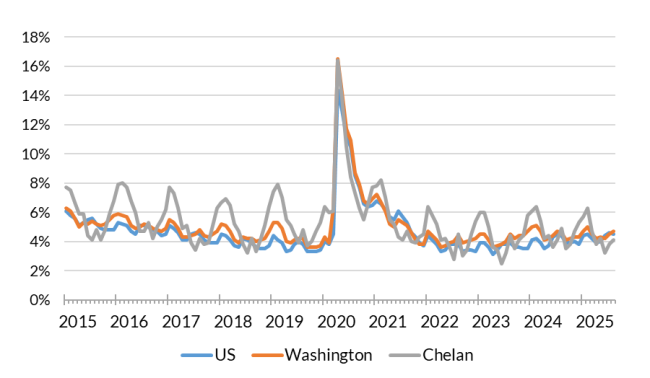
The National Bureau of Economic Research (NBER) announced that the recent “great” national recession occurred from December 2007 through June 2009. But the effects of this recession hit the Wenatchee MSA counties’ labor force primarily in 2010 when the average annual, not seasonally adjusted unemployment rate peaked at 9.2 percent. From 2011 through 2018, the average annual unemployment rate across the Wenatchee MSA was generally on a downtrend, and the average unemployment rate of 4.8 percent in 2018 was the lowest reading since ESD began compiling data electronically in 1990. In 2019, the unemployment rate elevated to 5.2 percent before soaring to 8.2 percent (a sharp three percentage point jump) during the heyday of the COVID-19 pandemic in 2020. Yet, as high as this unemployment rate was in 2020, it did not equal the extremely high 9.2 percent reading during the recent Great Recession. 

The Wenatchee MSA’s CLF edged upwards by 0.8 percent between 2020 (66,257 residents) and 2021 (66,781 residents). The labor force expanded in the last seven months of 2021 and has continued to grow into the first three months of 2022 (the most current data at the time of report preparation). This encouraging growth pattern in the CLF follows year-over-year contractions during each of the 12 months from June 2020 through May 2021.

Recently, the local labor force escalated from 63,930 residents in March 2021 to 66,092 in March 2022, a 3.4 percent upturn. Also, the resident employment growth pace of 4.6 percent is noteworthy. It shows that 2,754 more Chelan or Douglas County residents were employed in March 2022 than in March 2021; and it likely indicates that more employed residents are either commuting or teleworking to jobs outside of Chelan or Douglas counties. Finally, the number of unemployed residents in the Wenatchee MSA declined from 4,242 in March 2021 to 3,650 in March 2022, a -14.0 percent decrease. In effect, the 3.4 percent CLF expansion combined with this -14.0 percent drop in the number of unemployed caused the Wenatchee MSA’s unemployment rate to fall from 6.6 percent in March 2021 to 5.5 percent in March 2022.

Another encouraging economic sign is that the Wenatchee MSA’s CLF in March 2022 (66,092 residents) was 1,335 residents (2.1 percent) greater than the 64,757 residents in the labor force back in March 2020 (i.e., pre-COVID-19). This indicates that the local labor force is rebounding to pre-COVID-19 levels.

Source: Employment Security Department/DATA Division

(back to top)

 
Industry employment

Current industry employment statistics are available on the Labor area summaries page.

The analysis in the first part of this section is derived primarily from Current Employment Statistics (CES) data. One advantage of these data is that the employment information is updated monthly using CES employment estimates. However, estimates are nonfarm related, (i.e., they do not include agricultural employment figures). In addition, these data combine employment figures for Chelan and Douglas counties into the two-county Wenatchee MSA.

The analysis in the second part of this section is derived from the Bureau of Labor Statistics’ Quarterly Census of Employment and Wage (QCEW) program, conducted by the ESD. It takes a little longer to acquire QCEW data, but it is more detailed than CES data and it provides employment, wage and size of firm figures down to the county level. QCEW data include agricultural and nonfarm employment and wages for firms, organizations, and individuals whose employees are covered by the Washington State Employment Security Act. Also included are data for federal government agencies covered by Title 5, U.S.C. 85. Covered employment generally exceeds 85.0 percent of total employment in the state of Washington. Types of jobs not covered under the unemployment compensation system, and hence not included in QCEW data, include casual laborers not performing duties in the course of the employer’s trade or business such as:

  • Railroad personnel
  • Newspaper delivery people
  • Insurance or real estate agents paid on a commission basis only
  • Non-covered employees working for parochial schools, religious or non-profit organizations
  • Employees of sheltered workshops
  • Inmates working in penal institutions
  • Non-covered corporate officers

Analysis using CES data:

The NBER announced that a severe national recession occurred from December 2007 through June 2009. However, in the Wenatchee MSA, nonfarm employment “peaked” at a pre-recession high of 40,200 jobs in 2008 with the effects of the recession (i.e., job losses) being felt in 2009 and 2010. The “trough” of the recession occurred in 2010 when nonfarm employment in the Wenatchee MSA sank to an average of 38,100 jobs. It then took six years, from 2009 until 2014 (inclusively), for the Wenatchee MSA economy to regain and surpass the 40,200-job level of calendar year 2008. It did so in 2014 when the Wenatchee MSA nonfarm market averaged 40,600 jobs. Since the low point of 38,100 jobs in 2010, the local economy expanded for nine consecutive years from 2011 through 2019, inclusively.

Following is a summary of average annual nonfarm job changes in the Wenatchee MSA in the last two completed years (2020 and 2021):

  • In 2020, COVID-19-related layoffs caused nonfarm employment to retrench to an average of 43,400, a -6.3 percent and 2,900 job decline from the 46,300 jobs tallied in 2019.
  • In 2021, the Wenatchee MSA’s nonfarm economy bounced back to 45,700 jobs, a 2,300 job and 5.3 percent increase – more robust than the 2.3 percent growth rate statewide. The main contributors to this 2,300 job upturn in calendar year 2021 were leisure and hospitality (up 900 jobs and 16.5 percent), retail trade (up 400 jobs and 6.3 percent), manufacturing (up 300 jobs and 10.6 percent) and construction (up 300 jobs and 10.8 percent).

(back to top)

Analysis using QCEW data:

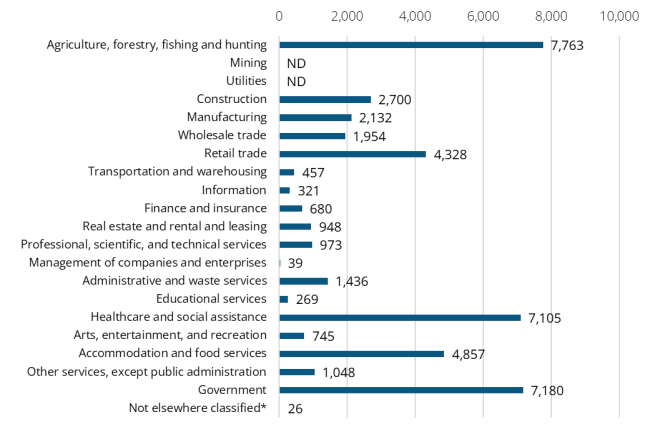
The North American Industry Classification System (NAICS) is an industry classification system that groups businesses/organizations into categories or sectors based on the activities in which they are primarily engaged. There are 19 private sectors and three government sectors (for a total of 22 sectors) at the 2-digit NAICS code level within each county-level economy. One can observe much about the structure of a county’s economy by quantifying and comparing the number of jobs and the percentage of jobs in these sectors by using average annual QCEW data. The most recent average annual employment data available for Chelan and Douglas counties are for 2020.

The top five Chelan County sectors in 2020 in terms of employment were:

 Industry Sector Number of jobs Share of employment
 1. Agriculture, forestry and fishing 8,708    21.3% 
 2. Health services 6,478  15.8% 
 3. Local government 4,963  12.1% 
 4. Retail trade 4,182  10.2% 
 5. Accommodation and food services 3,623  8.9% 
 All other industries 12,917  31.6% 
 Total covered employment 40,871   100% 

Source: Employment Security Department/DATA Division, QCEW

Chelan County’s covered employment of 40,871 in 2020 was nearly three and a half times larger than neighboring Douglas County’s covered employment of 11,875 jobs. More than two-thirds (68.4 percent) of all jobs in Chelan County were in five, two-digit NAICS industries or sectors (i.e., agriculture, health services, local government, retail trade, and accommodation and food services), indicating that this is not a tremendously diverse economy. This is not unusual. The economic structure of Chelan County is representative of the labor market structures of many agricultural-based economies (i.e., in Adams, Douglas, Grant, Okanogan and Yakima counties) throughout Central Washington.

Covered employment trends over the last 10 years (from 2010 through 2020) were analyzed using the ESD’s average annual QCEW data for the 22 two-digit NAICS sectors in Chelan County. Following are some of the findings:

  • Agriculture accounted for 23.5 percent of all jobs countywide in 2010 versus 21.3 percent in 2020. The number of agricultural jobs (NAICS 11) dropped from 8,983 in 2010 to 8,708 in 2020 across Chelan County, a 275 job and -3.1 percent employment downturn. Agriculture was the sector (of all two-digit 22 NAICS sectors) which lost the second-greatest number of jobs in the Chelan County covered labor market in this 10-year timeframe. The sector which (“on paper”) lost the greatest number of jobs from 2010 to 2020 was other services. However, this “loss” of other services jobs and wages and the corresponding “gain” in health services jobs and wages were due to the BLS-directed reclassification of private households (NAICS 814) into services for the elderly and disabled (NAICS 624). This agricultural employment downtrend equated to an annualized loss rate of -0.3 percent across Chelan County from 2010 to 2020 versus an annualized total covered employment growth pace of 0.7 percent. There are probably many reasons for this 10-year decline in agricultural employment countywide; but at least three possibilities: automation, the gradual conversion of some seasonal agricultural jobs to year-round positions, and the increased use of H-2A agricultural labor.
  • Private health services tallied 12.7 percent of total covered employment in 2010 versus 15.8 percent of total covered employment in 2020. True, some of this upturn was due to private household employment and wages (NAICS 814) being administratively reclassified into services for the elderly and disabled (NAICS 624) in first quarter 2014. Nevertheless, the number of health services (NAICS 62) jobs rose dramatically from 4,836 in 2010 to 6,478 in 2020, a 1,642 job and 34.0 percent employment increase, ranking health services as the sector adding the greatest number of jobs to the Chelan County economy in during this10-year period. In fact, Chelan County is becoming a hub for state-of-the art medical services in Central Washington.
  • Administrative and waste services (NAICS 56) was the ninth-largest sector (of the 22 NAICS sectors) in Chelan County in 2020 in terms of employment. However, this sector (which includes temporary employment agencies, janitorial services, landscaping services, carpet and upholstery cleaning services, etc.) added more jobs on a percentage basis between 2010 and 2020 than any other local industry. In 2010, administrative and waste businesses provided 576 jobs, but by 2020, this number had soared 109.4 percent to 1,206 jobs. In terms of annualized job-growth rates between 2010 and 2020, total covered employment in Chelan County expanded at a 0.7 percent pace, while the annualized job-growth rate in administrative and waste services was 7.7 percent – quite a difference.

(back to top)

The top five Douglas County sectors in 2020 in terms of employment were:

 Industry Sector Number of jobs Share of employment
 1. Agriculture, forestry and fishing 2,690  22.7% 
 2. Retail trade 1,837  15.5% 
 3. Local government 1,806  15.2% 
 4. Accommodation and food services 843  7.1% 
 5. Health services 839  7.1% 
 All other industries 3,860  32.5% 
 Total covered employment 11,875  100% 

Source: Employment Security Department/DATA Division, QCEW

Douglas County’s covered employment of 11,875 in 2020 was 29.1 percent of Chelan County’s covered employment of 40,871 jobs. More than two-thirds (67.5 percent) of all jobs in Douglas County were in five, two-digit NAICS industries or sectors (i.e., agriculture, retail trade, local government, accommodation and food services and private health services) indicating that this is not a diverse economy. This is not unusual. The economic structure of Douglas County is representative of the labor market structures of many agricultural-based economies (i.e., in Adams, Chelan, Grant, Okanogan and Yakima counties) throughout Central Washington.

Covered employment trends over the last 10 years (from 2010 through 2020) were analyzed using the ESD’s average annual QCEW data for the 22 two-digit NAICS sectors in Douglas County. Following are some of the findings:

  • Agriculture accounted for 28.1 percent of all jobs countywide in 2010 versus 22.7 percent in 2020. The number of agricultural jobs (NAICS 11) dropped from 3,038 in 2010 to 2,690 in 2020 across Douglas County, a 348 job and -11.5 percent employment downturn. Agriculture was the sector (of all two-digit 22 NAICS sectors) which lost the greatest number of jobs in the Douglas County covered labor market in this 10-year timeframe. This agricultural employment downtrend equated to an annualized loss rate of -1.2 percent across Douglas County from 2010 to 2020 versus an annualized total covered employment growth pace of 0.7 percent. Despite this employment downtrend, agriculture still provided more jobs than any other sector in calendar year 2020. There are probably many reasons for this 10-year decline in the number of agricultural jobs countywide; with at least three possibilities: automation, the gradual conversion of some seasonal agricultural jobs to year-round positions, and the increased use of H-2A agricultural labor.
  • Retail trade tallied the second-highest number of jobs in Douglas County in 2020 with employment averaging 1,837 jobs. This sector (NAICS 44-45) accounted for 12.4 percent of total covered employment in 2010, and 15.5 percent of total covered employment in 2020. In 2010, retail trade businesses provided 1,346 jobs, but by 2020, retail trade employment climbed to 1,837 countywide, up by 491 jobs and 36.5 percent. Retail trade netted more new jobs than any other sector in this 10-year period. Also, 41.3 percent of these 491 new retail trade jobs were in the motor vehicle and parts dealers (NAICS 441) subsector, wherein employment jumped from 138 in 2010 to 341 in 2020 (up 147.1 percent).
  • In 2010, the construction sector (NAICS 23) accounted for 4.1 percent of total covered employment in Douglas County, but this percentage increased to 5.8 percent in 2020. Quantitatively, employment escalated from 446 jobs in 2010 to 689 in 2020 – a robust 54.5 jump. Of all two-digit 22 NAICS sectors in Douglas County, construction added the second-greatest number of jobs during this 10-year timeframe. This construction employment “boom” equated to an annualized growth rate of 4.4 percent across Douglas County from 2010 to 2020 versus an annualized total covered employment growth pace of 0.7 percent.

For historical industry employment data, contact an economist.

Source: Employment Security Department/DATA Division, QCEW


Industry employment by age and gender

The Local Employment Dynamics (LED) database, a joint project of state employment departments and the U.S. Census Bureau, matches state employment data with federal administrative data. Among the products is industry employment by age and gender. All workers covered by state unemployment insurance data are included; federal workers and non-covered workers, such as the self-employed, are not. Data are presented by place of work, not place of residence.

Chelan County highlights – 2020

  • The county’s largest job holder age group was the 55+ year-olds, with 27.1 percent of the workforce. This group was followed by the 35 to 44-year-old group which accounted for 21.4 percent of Chelan County’s workforce.
  • Male-dominated industries included construction (82.4 percent), utilities (74.9 percent) and transportation and warehousing (74.5 percent).
  • Female-dominated industries included health care and social assistance (76.2 percent), finance and insurance (75.5 percent) and educational services (67.8 percent).

Douglas County highlights – 2020

  • The county’s largest job holder age category in Douglas County was the 55+ year-old group, accounting for 26.9 percent of the workforce. In second place were the 35 to 44-year-olds with 21.0 percent of the workforce.
  • Male-dominated industries included construction (81.8 percent), utilities (75.6 percent) and manufacturing (72.3 percent).
  • Female-dominated industries included health care and social assistance (80.7 percent), management of companies and enterprises (71.8 percent) and educational services (71.0 percent).

Source: The Local Employment Dynamics

(back to top)


Wages and income

The total covered payroll in 2020 in Chelan County was approximately $1.88 billion. The average annual wage was $46,080 or 60.0 percent of the state average of $76,801.

The top five Chelan County industries in 2020 in terms of payrolls were:

Industry Sector Payroll Share of payrolls
 1. Health services $421,181,232   22.4% 
 2. Local government $315,932,518   16.8% 
 3. Agriculture, forestry and fishing $279,141,554   14.8% 
 4. Retail trade $140,757,970  7.5% 
 5. Wholesale trade $117,270,485  6.2% 
 All other industries $609,037,248  32.9% 
 Total covered payrolls $1,883,321,007  100% 

Source: Employment Security Department/DATA Division, QCEW

Covered wage trends from 2010 through 2020 were analyzed using the ESD’s average annual QCEW data for the 22 two-digit NAICS sectors in Chelan County. Following are some of the findings:

  • Private health services (NAICS 62) employers provided the largest payroll in Chelan County in 2020, and ranked first in covered wage growth (up by $172.6 million) in this recent 10-year period. Total covered wage growth from 2010 through 2020 was $649.5 million.
  • Agricultural (NAICS 11) employers provided the third-largest payroll in Chelan County in 2020, but ranked second (up by $107.3 million) in total covered wage growth (up by $649.5 million) during this 10-year period.

The top five Douglas County industries in 2020 in terms of payrolls were:

Industry Sector Payroll Share of payrolls
 1. Local government $114,944,028   22.9% 
 2. Agriculture, forestry and fishing $80,580,499    16.0% 
 3. Retail trade $66,796,243   13.3% 
 4. Construction $33,743,092   6.7% 
 5. Wholesale trade $32,514,703    6.5% 
 All other industries $173,812,821   34.6% 
 Total covered payrolls $502,391,386   100% 

Source: Employment Security Department/DATA Division, QCEW

Covered wage trends from 2010 through 2020 were analyzed using the ESD’s average annual QCEW data for the 22 two-digit NAICS sectors in Douglas County. Following are some of the findings:

  • Local government agencies provided the largest payroll in Douglas County in 2020, and ranked first in covered wage growth (up by $37.7 million) during this 10-year period. Total covered wage growth from 2010 through 2020 was $189.5 million.
  • Retail trade (NAICS 44-45) employers provided the third-largest payroll in Douglas County in 2020, but ranked second (up by $32.0 million) in total covered wage growth (up by $189.5 million) during this 10-year period.

Personal income

Personal income includes earned income, investment income, and government payments such as Social Security and Veterans Benefits. Investment income includes income imputed from pension funds and from owning a home. Per capita personal income equals total personal income divided by the resident population.

QuickFacts reported that per capita income for the period 2016 to 2020 (in 2020 dollars) was $32,249, and Douglas County’s per capita income was $32,709. Washington’s inflation adjusted per capita income was $40,837 and the nation was $35,384.

Median household income for the period 2016 to 2020 (in 2019 dollars) was $61,304 for Chelan County and $65,730 for Douglas County compared to the state at $77,006 and the nation at $64,994.

Chelan County’s poverty rate was 8.3 percent and Douglas County’s was 10.5 percent over the same period. In comparison, Washington state’s rate was 9.5 percent and the nation’s rate was 11.4 percent, according to the U.S. Census Bureau QuickFacts.

Source: Employment Security Department/DATA Division; Bureau of Labor Statistics; Bureau of Economic Analysis; U.S. Census Bureau QuickFacts

(back to top)


Population

U.S. Census data show that:

  • Chelan County’s population on April 1, 2020 was 79,074, growing 9.1 percent from April 1, 2010. The pace of growth in the county’s population was less robust than the state’s 14.6 percent growth rate during this period.
  • Douglas County’s population on April 1, 2020 was 42,938, growing 11.7 percent from April 1, 2010. The county’s growth rate was more rapid than neighboring Chelan County’s 9.1 percent growth pace, yet was slower than the state’s 14.6 percent growth rate in this period.

The most recent population growth rate in Chelan County (from April 1, 2020 to July 1, 2021) was 0.7 percent. In Douglas County it was 1.8 percent. Both rates were faster than that of the state at 0.4 percent. Although these estimated population changes are only for a one-year period, anecdotal evidence suggests that the COVID-19 pandemic made teleworking an option in 2020 and 2021 – an option which did not exist for many workers prior to the pandemic. Hence, proportionately more people may be migrating to, and residing in, Chelan or Douglas counties, yet working for firms based elsewhere. It also appears possible that the natural beauty of Chelan and Douglas counties’ bountiful outdoor recreational opportunities, and reasonably priced land are enticing some “Westside” retirees to settle, or at least have a second home here. It will be interesting to see whether the relatively slow population growth in Chelan and Douglas counties during the last U.S. Census (2010 to 2020) will reverse itself in the next U.S. Census (2020 to 2030).

Source: U.S. Census Bureau QuickFacts


Population facts

Chelan County Douglas County Washington state
 Population 2020 79,074  42,938   7,705,281  
 Population 2021 79,646  43,696   7,738,692  
 Percent change, 2020 to 2021 0.7%  1.8%  0.4% 

Source: U.S. Census Bureau QuickFacts


Age, gender and ethnicity

As of July 1, 2021, the percent of the population age 65 and older in Chelan County was 19.6 percent, and in Douglas County it was 18.2 percent. Both counties tallied a greater proportion of residents age 65 and up versus Washington state (15.9 percent).

Chelan and Douglas counties each recorded between one-quarter and one-third of their total populations in 2021 as Hispanic or Latino. Specifically, the share of Hispanics was 28.2 percent in Chelan County and 32.3 percent in Douglas County, higher than the 13.0 percent ratio statewide.


Demographics

Chelan County Douglas County Washington state
 Population by age, 2021
Under 5 years old 6.1%  6.5%  6.0% 
Under 18 years old 23.2%  25.8%  21.8% 
65 years and older 19.6%  18.2%  15.9% 
 Females, 2021 49.9%  49.4%  49.9% 
 Race/ethnicity, 2021
White 93.2%  92.9%  78.5% 
Black 0.9%  0.8%  4.4% 
American Indian, Alaskan Native 2.0%  2.1%  1.9% 
Asian, Native Hawaiian, other Pacific Islander 1.5%  1.4%  10.4% 
Hispanic or Latino, any race 28.2%  32.3%  13.0% 

Source: U.S. Census Bureau QuickFacts


Educational attainment

According to the 2016 to 2020 American Community Survey (ACS), a lower percentage of adults age 25 years and older in Chelan County (83.7 percent) and in Douglas County (82.6 percent), were high school graduates or higher than in the state (91.7 percent). Correspondingly, there were fewer college graduates in these counties compared to the state. In Chelan County, 26.4 percent of residents age 25 and older held a bachelor’s degree or higher, while in Douglas County the share was only 20.6 percent. Conversely, in Washington state, the percent of the adult population earning a bachelor’s degree or higher was 36.7 percent.

Source: U.S. Census Bureau QuickFacts


Useful links

(back to top)