
- Posted May 2025
April 2025 Highlights
In April, the not seasonally adjusted unemployment rate decreased from 4.3% to 3.9% and total nonfarm employment decreased by 30 jobs from March.
Summary
Total nonfarm employment was estimated at 16,690 jobs in April 2025. This is down 160 jobs compared to March 2025 and up 30 jobs over the year. The labor force in Island County has 36,121 workers. Within that estimate, 1424 workers were considered unemployed. The size of the labor force increased by 770 workers over the year. The unemployment rate in Island County decreased from 4.3% to 3.9% over the month.
Geography
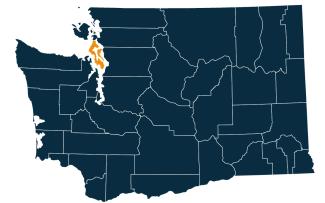
Island County is situated in the Salish Sea in northwest Washington. As its name suggests, it is made up of several islands. The two largest are Whidbey and Camano. Island County is the second smallest county in Washington by landmass, just larger than neighboring San Juan County. Island County is bounded to the north by Deception Pass and to the south by Puget Sound. Skagit Bay and Saratoga Passage are located to the east and Admiralty Inlet and the Strait of Juan de Fuca are west. Skagit and Snohomish counties lie to the east of Island County and the Olympic Peninsula lies across the water to the west.
Island County is one of six counties included in the Seattle-Tacoma Consolidated Metropolitan Statistical Area (CMSA).
The largest employer is U.S. Naval Air Station Whidbey Island in Oak Harbor. Oak Harbor is the largest city in the county.
Island County is part of the Northwest Workforce Development Area. Visit the Workforce Training & Education Coordinating Board website for information about the 12 regions.
Employment situation for April 2025
Labor force and unemployment
-
The not seasonally adjusted unemployment rate was 3.9% in April 2025, down from 4.3% in March 2025 and down relative to 4.2% in April 2024.
-
The labor force increased by 770 workers from April 2024. In April 2025 there were an estimated 36,121 workers in Island County.
Unemployment rate, not seasonally adjusted
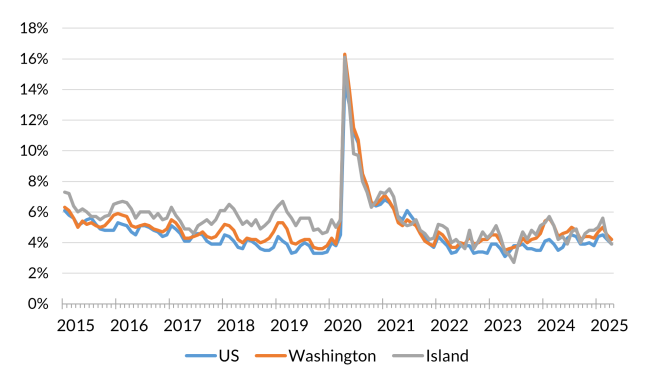
Source: Employment Security Department/Labor Market Information and Research Division, Local area unemployment statistics
Payroll employment
-
Total nonfarm employment decreased by 160 jobs from March, bringing the estimated job count to 18,690 jobs. The figure is up 30 jobs relative to April 2024.
-
Construction employment was up 10 jobs from April 2024 and up 20 jobs from March 2025.
-
Manufacturing was down 20 jobs from April 2024 and unchanged from March 2025.
-
Retail trade was down 50 jobs from April 2024 and unchanged over the month.
-
Professional and business services was down by 60 jobs over the year and 10 jobs from March 2025.
-
Private education and health services was up 100 jobs from April 2024, however down 10 jobs from March 2025.
-
Leisure and hospitality was up by 50 jobs from April 2024, however down 150 jobs from March 2025.
Nonfarm employment estimates, not seasonally adjusted, Island County
| NAICS Industry Title | Apr 2025 (Prelim) | Mar 2025 (Revised) | Apr 2024 (Revised) | Mar 2025 to Apr 2025 Change | Apr 2024 to Apr 2025 Change | Apr 2024 to Apr 2025 % Change |
|---|---|---|---|---|---|---|
| Total nonfarm | 18,690 | 18,850 | 18,660 | -160 | 30 | 0.2% |
| Total private (total nonfarm less government) | 13,910 | 14,080 | 13,890 | -170 | 20 | 0.1% |
| Goods-producing | 2,010 | 1,990 | 2,010 | 20 | 0 | 0.0% |
| - Mining and logging | 10 | 10 | 10 | 0 | 0 | 0.0% |
| - Construction | 1,290 | 1,270 | 1,280 | 0 | 0 | 0.0% |
| - Manufacturing | 700 | 700 | 720 | 10 | 10 | 1.4% |
| Service-providing | 16,680 | 16,860 | 16,650 | -180 | 30 | 0.2% |
| - Wholesale trade | 280 | 280 | 260 | 0 | 20 | 7.7% |
| - Retail trade | 2,120 | 2,120 | 2,170 | 0 | -50 | -2.3% |
| - Transportation, warehousing, and utilities | 250 | 250 | 250 | 0 | 0 | 0.0% |
| - Information | 270 | 260 | 260 | 10 | 10 | 3.8% |
| - Financial activities | 680 | 670 | 700 | 10 | -20 | -2.9% |
| - Professional and business services | 1,800 | 1,810 | 1,860 | -10 | -60 | -3.2% |
| - Private education and health services | 2,900 | 2,910 | 2,800 | -10 | 100 | 3.6% |
| - Leisure and hospitality | 2,700 | 2,840 | 2,650 | -140 | 50 | 1.9% |
| - Other services | 900 | 950 | 930 | -50 | -30 | -3.2% |
| - Government | 4,780 | 4,770 | 4,780 | 10 | 0 | 0.0% |
Note: Data benchmarked through December 2024, updated May 16, 2025.
Source: Employment Security Department/Labor Market Information and Research Division, Washington employment estimates (WA-QB & CES)
Detailed tables can be found on the source page in the third spreadsheet titled Current employment estimates, not seasonally adjusted.
Industry employment (covered employment)
Employment by industry, Island County 2023 annual average
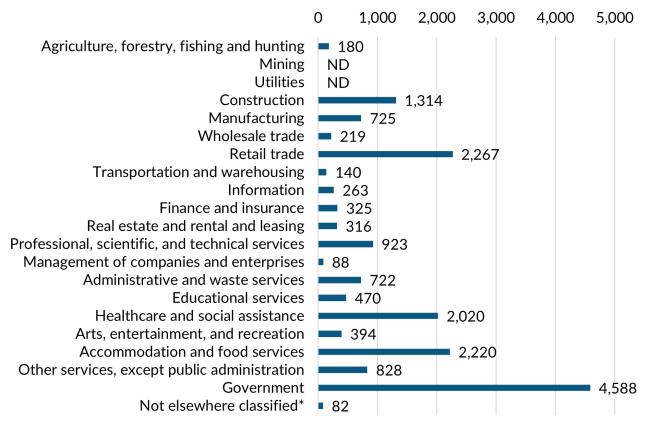
Note: ND stands for not disclosed. ND is used to avoid disclosing data for individual employers. Industries labeled ND are grouped in the Not elsewhere classified category.
Source: Employment Security Department/Labor Market Information and Research Division, Covered Employment (QCEW)
Average annual covered employment in Island County was 18,095 in 2023. Covered employment refers to workers who received wages in Washington state and are eligible for state and federal unemployment insurance (UI) compensation programs.
Wages can vary substantially from one industry sector to another. The average annual wage in Washington state for all industries was $87,054 in 2023. The average annual wage in Island County was $55,071 in 2023.
Top sectors in terms of employment in 2023:
-
Government (4,588)
-
Retail trade (2,267)
-
Accommodation and food services (2,220)
-
Health care and social assistance (2,020)
-
Construction (1,314)
The top sectors in terms of wage in 2023:
-
Professional, scientific, technical ($112,683)
-
Finance and insurance ($106,646)
-
Mining and Utilities* ($91,835)
-
Wholesale trade ($84,675)
-
Information ($74,181)
Workforce demographics in Island County
Age
| Demographic characteristic | Total | Labor force participation rate | Unemployment rate |
|---|---|---|---|
| Population 16 years and over | 73,254 | 57.0% | 4.7% |
| 16 to 19 years | 3,479 | 46.5% | 22.8% |
| 20 to 24 years | 5,779 | 91.2% | 11.9% |
| 25 to 29 years | 5,632 | 80.5% | 3.1% |
| 30 to 34 years | 5,445 | 82.9% | 3.6% |
| 35 to 44 years | 10,114 | 82.6% | 4.6% |
| 45 to 54 years | 8,285 | 81.7% | 3.1% |
| 55 to 59 years | 5,106 | 75.2% | 2.6% |
| 60 to 64 years | 6,774 | 49.7% | 3.0% |
| 65 to 74 years | 13,659 | 19.5% | 1.5% |
| 75 years and over | 8,981 | 8.9% | 0.0% |
Race or Hispanic origin
| Demographic characteristic | Total | Labor force participation rate | Unemployment rate |
|---|---|---|---|
| White alone | 59,206 | 54.6% | 4.7% |
| Black or African American alone | 2,014 | 76.8% | 5.2% |
| American Indian and Alaska Native alone | 717 | 71.5% | 3.8% |
| Asian alone | 3,777 | 62.9% | 5.7% |
| Native Hawaiian and other Pacific Islander alone | 281 | 91.1% | 0.0% |
| Some other race alone | 1,467 | 78.5% | 2.4% |
| Two or more races | 5,792 | 61.3% | 4.0% |
| Hispanic or Latino origin (of any race) | 5,209 | 75.8% | 6.6% |
| White alone, not Hispanic or Latino | 57,586 | 53.9% | 4.4% |
| Population 20 to 64 years | 47,135 | 77.8% | 4.3% |
Sex
| Demographic characteristic | Total | Labor force participation rate | Unemployment rate |
|---|---|---|---|
| Male | 24,351 | 84.9% | 4.6% |
| Female | 22,784 | 70.2% | 3.9% |
Females with children
| Demographic characteristic | Total | Labor force participation rate | Unemployment rate |
|---|---|---|---|
| With own children under 18 | 7,543 | 68.8% | 2.1% |
| With own children under 6 only | 2,419 | 68.6% | 4.5% |
| With own children under 6 and 6 to 17 | 1,787 | 64.7% | 0.9% |
| With own children 6 to 17 only | 3,337 | 71.1% | 1.3% |
Poverty status in the past 12 months
| Demographic characteristic | Total | Labor force participation rate | Unemployment rate |
|---|---|---|---|
| Below poverty level | 3,314 | 35.6% | 11.3% |
| At or above the poverty level | 41,866 | 80.3% | 4.0% |
Disability status
| Demographic characteristic | Total | Labor force participation rate | Unemployment rate |
|---|---|---|---|
| With any disability | 5,632 | 54.2% | 5.2% |
Educational attainment
| Demographic characteristic | Total | Labor force participation rate | Unemployment rate |
|---|---|---|---|
| Population 25 to 64 years | 41,356 | 75.9% | 3.5% |
| Less than high school graduate | 1,946 | 61.4% | 9.6% |
| High school graduate (includes equivalency) | 10,107 | 76.7% | 3.1% |
| Some college or associate's degree | 16,605 | 73.7% | 3.5% |
| Bachelor's degree or higher | 12,698 | 80.3% | 3.0% |
Source: U.S. Census Bureau, American Community Survey 5-year estimates, S2301 | Employment Status
This workforce product was funded by a grant awarded by the U.S. Department of Labor's Employment and Training Administration. The product was created by the recipient and does not necessarily reflect the official position of the U.S. Department of Labor. The Department of Labor makes no guarantees, warranties, or assurances of any kind, expressed or implied, with respect to such information, including any information on linked sites and including, but not limited to, accuracy of the information or its completeness, timeliness, usefulness, adequacy, continued availability, or ownership. This product is copyrighted by the institution that created it. Internal use by an organization and/or personal use by an individual for non-commercial purposes is permissible. All other uses require the prior authorization of the copyright owner.