
Released on
FOR IMMEDIATE RELEASE
Contact: media@esd.wa.gov
January state payroll employment shows strong job gains, but unemployment rate moves up
OLYMPIA – Washington’s economy gained an estimated 10,800 jobs (seasonally adjusted) in January. Job growth was highest in the following industries: construction; transportation, warehousing & utilities; leisure & hospitality; and manufacturing.
Washington’s monthly unemployment rate rose from 4.2% to 4.6% in January.
"The state’s job market continues to be resilient even as the unemployment rate has risen,' said the Employment Security Department’s (ESD) State Economist Paul Turek. "This month’s report includes annual benchmark revisions as well as revised seasonal factors. The revisions show an even more robust rate of job growth over 2022 than what had previously been estimated.'
Visit ESD’s website to view the entire Monthly Employment Report for January.
ESD paid unemployment insurance benefits to 60,657 people in January, an increase of 7,942 paid claims over the previous month. Seasonal increases in paid claims within construction and the professional, scientific, and technical services sectors contributed to the overall increase in paid claims over the month.
National unemployment rate
The national unemployment rate decreased slightly in January from 3.5% to 3.4%. For comparison, the national unemployment rate (revised) for January 2022 was 4.0%.
Updated state preliminary data for December 2022
- The preliminary estimated gain of 2,500 jobs for December 2022 was revised upwards to a gain of 7,700 jobs.
- The seasonally adjusted monthly unemployment rate was confirmed at 4.2%.
Labor force adds more participants
The state’s labor force in January numbered 4,023,000 – an increase of 20,500 people from the previous month.
In the Seattle/Bellevue/Everett region, the labor force increased by 12,100 over the same period.
Labor force is defined as the total number of people, both employed and unemployed, over the age of 16. Layoffs and labor force participation are not necessarily connected. When someone is laid off but still seeking work, they remain a part of the labor force. A drop in the labor force means the individual has left work and hasn't been actively seeking employment for more than four weeks.
From January 2022 to January 2023, the state’s labor force increased by 62,600, while the Seattle/Bellevue/Everett region increased by 46,600.
From December to January, the number of people who were unemployed statewide increased from 167,500 to 184,500. In the Seattle/Bellevue/Everett region, the number of people who were unemployed increased from 53,200 to 57,000 over the same period.
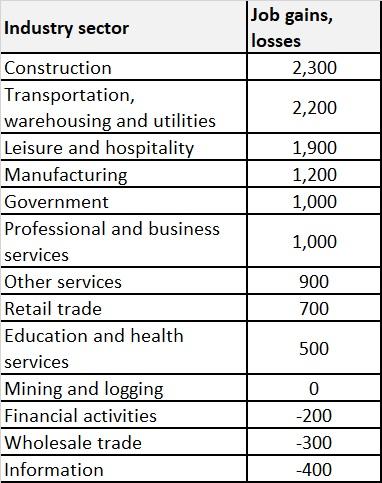
Private sector employment increased by 9,800 jobs while government employment increased by 1,000 jobs.
Of the industry sectors, in January:
- Nine expanded
- Three contracted
- One was unchanged
The largest increase in jobs during the past month was in the construction sector. Residential building construction, primarily responsible for the construction or remodeling and renovation of single-family and multifamily residential buildings, accounted for 900 of the 2,300 construction jobs added over the month.
The transportation, warehousing & utilities sector had the second largest increase in jobs over the month. Increases in truck transportation (+800) and warehousing & storage (+800) contributed to the overall 2,200 increase in jobs.
All major industry groups added jobs over the course of the year
Washington gained an estimated 138,400 jobs from January 2022 to January 2023, not seasonally adjusted. Private sector employment rose by 4.3%, up an estimated 121,300 jobs, while public sector employment rose by 3.1% — up an estimated 17,100 jobs.
From January 2022 – January 2023, all 13 major industry sectors expanded
The three industry sectors with the largest employment gains year over year, not seasonally adjusted, were:
- Leisure and hospitality, up 26,900 jobs.
- Professional and business services, up 25,200 jobs.
- Education and health services, up 19,300 jobs.
Table 1: Washington’s total jobs
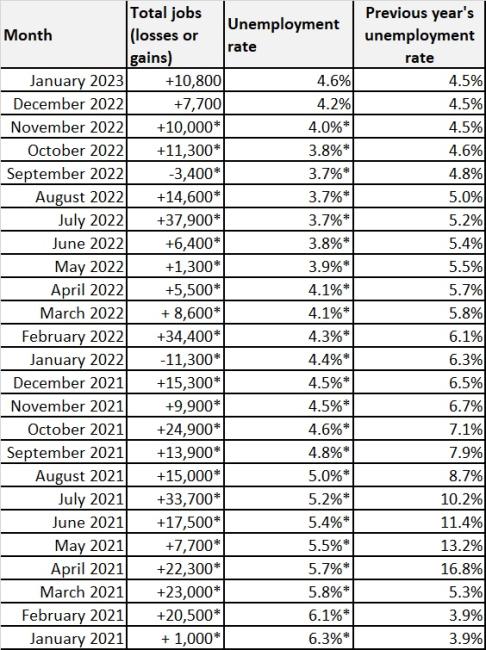
*Revised from previous preliminary estimates. Preliminary monthly estimates for jobs losses or gains are based on a small
Bureau of Labor Statistics payroll survey while actual figures reported the following month are based on a more complete survey.
Table 2: Job gains and losses by industry sector
Labor market information
See more labor market information and tools, including interactive Tableau graphics, to highlight popular information and data.
WorkSource
Employment Security is a proud partner in the statewide WorkSource system, which provides employment and training assistance to job seekers and businesses. WorkSourceWA provides access to thousands of Washington jobs and other employment resources. WorkSource staff can connect job seekers with employers hiring right now in their community, identify training opportunities or help them brush up on application and interview skills. Job seekers and employers can find their nearest WorkSource center on the WorkSource office locator page.
Learn more about ESD’s monthly employment reports
Every month, the Employment Security Department publishes preliminary seasonally adjusted estimates for the prior month’s job growth and unemployment. We also publish confirmed data for the month before last. See the entire Monthly Employment Report on our website.
Monthly Employment Report publication schedule for 2023
|
Preliminary data for the month |
State and Seattle Metropolitan Division data release |
All other county data released |
|
January |
March 7, 2023 |
March 7, 2023 |
|
February |
March 22, 2023 |
March 28, 2023 |
|
March |
April 19, 2023 |
April 25, 2023 |
|
April |
May 17, 2023 |
May 23, 2023 |
|
May |
June 14, 2023 |
June 20, 2023 |
|
June |
July 19, 2023 |
July 25, 2023 |
|
July |
August 16, 2023 |
August 22, 2023 |
|
August |
September 13, 2023 |
September 19, 2023 |
|
September |
October 18, 2023 |
October 24, 2023 |
|
October |
November 15, 2023 |
November 21, 2023 |
|
November |
December 20, 2023 |
December 26, 2023 |
|
December |
January 17, 2024 |
January 23, 2024 |
U-6 unemployment rate
The U.S. Bureau of Labor Statistics (BLS) updated its 'alternative measures of labor underutilization' for states to include annual averages for 2021. One such alternative measure is the U-6 rate, which considers not only the unemployed population in the official 'U-3' unemployment rate, but also marginally attached workers and those employed part time for economic reasons. The U-6 rate is defined by BLS as the 'total unemployed, plus all marginally attached workers, plus total employed part time for economic reasons, as a percent of the civilian labor force plus all marginally attached workers.' This U-6 measure measures the 'unemployed, underemployed, and those who are not looking but who want a job.'
The U-6 annual average unemployment rate for the four-quarter 2022 period for Washington state was 7.5%. This was lower compared to the 10.1% average annual U-6 unemployment rate for 2021. The U.S. U-6 average annual unemployment rate for 2022 was 6.9%.