

Posted October 2025
August 2025 highlights
From July to August, the not seasonally adjusted unemployment rate decreased from 7.2% to 7.1% and total nonfarm employment increased by 10 jobs.
Summary
Wahkiakum County has a small, rural economy, centered around the forestry sector. Other main industries include local government, retail trade, manufacturing, and accommodation and food services. Retirees and older workers make up a significant portion of the population.
During the COVID-19 pandemic, the unemployment rate in Wahkiakum County hit a peak of 14.3%. The unemployment rate is consistently one of the highest among Washington’s 39 counties, though it also has a high degree of seasonality.
Location
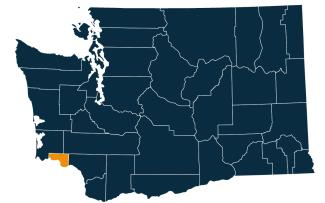
Wahkiakum County is one of the smallest in Washington in both size and population. It is located in the southwest of the state, along the Columbia River. The Wahkiakum County Ferry connects the town of Cathlamet to Clatsop County, Oregon, across the river. Other neighboring counties are Cowlitz County to the east, and Pacific and Lewis counties to the north.
Wahkiakum County, along with neighboring Clark and Cowlitz Counties, makes up Washington’s seventh Workforce Development Area. Visit the Workforce Training & Education Coordinating Board website for information about the 12 workforce regions.
Employment situation for August 2025
Labor force and unemployment
-
The not seasonally adjusted unemployment rate was 7.1% in August 2025, down from 7.2% in the previous month and down from 7.3% in August 2024.
-
The total civilian labor force was 1,227 in August 2025 and was little changed from 1,241 in August 2024.
Unemployment rate, not seasonally adjusted
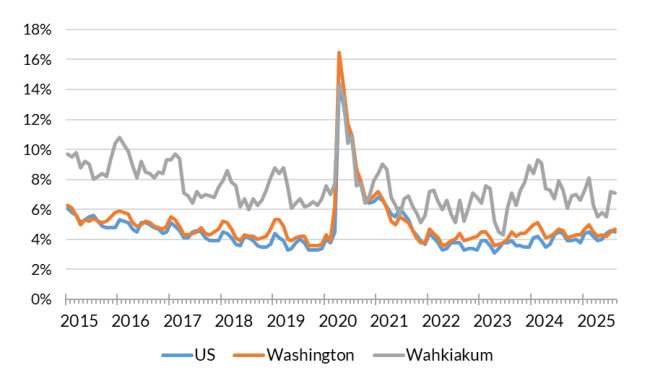
Source: Employment Security Department/Labor Market Information and Research Division, Local area unemployment statistics
Payroll employment
-
Total nonfarm employment was 730 in August 2025, not seasonally adjusted. This was up by 10 jobs from the previous month and unchanged from August 2024.
-
Over the course of 12 months ending in August 2025, goods producing industries added 30 jobs and service providing industries lost 30 jobs.
-
The largest increase over the year was in mining and logging, which added 30 jobs.
Nonfarm employment estimates, not seasonally adjusted, Wahkiakum County
| NAICS Industry Title | Aug 2025 (Prelim) | Jul 2025 (Revised) | Aug 2024 (Revised) | Jul 2025 to Aug 2025 Change | Aug 2024 to Aug 2025 Change | Aug 2024 to Aug 2025 % Change |
|---|---|---|---|---|---|---|
| Total nonfarm | 730 | 720 | 730 | 10 | 0 | 0.0% |
| Total private (total nonfarm less government) | 440 | 430 | 430 | 10 | 10 | 2.3% |
| Goods-producing | 140 | 130 | 110 | 10 | 30 | 27.3% |
| - Mining and logging | 40 | 30 | 10 | 10 | 30 | 300.0% |
| - Construction | 40 | 40 | 50 | 0 | -10 | -20.0% |
| - Manufacturing | 60 | 60 | 50 | 0 | 10 | 20.0% |
| Service-providing | 600 | 590 | 630 | 10 | -30 | -4.8% |
| - Trade, transportation, and utilities | 100 | 100 | 110 | 0 | -10 | -9.1% |
| - Wholesale trade | 10 | 10 | 10 | 0 | 0 | 0.0% |
| - Retail trade | 80 | 80 | 90 | 0 | -10 | -11.1% |
| - Information | 30 | 30 | 30 | 0 | 0 | 0.0% |
| - Financial activities | 20 | 20 | 20 | 0 | 0 | 0.0% |
| - Professional and business services | 40 | 40 | 40 | 0 | 0 | 0.0% |
| - Private education and health services | 50 | 50 | 50 | 0 | 0 | 0.0% |
| - Leisure and hospitality | 60 | 60 | 70 | 0 | -10 | -14.3% |
| - Other services | 10 | 10 | 10 | 0 | 0 | 0.0% |
| - Government | 300 | 290 | 300 | 10 | 0 | 0.0% |
Note: Data benchmarked through March 2025, updated September 15, 2025.
Source: Employment Security Department/Labor Market Information and Research Division, Washington employment estimates (WA-QB & CES)
Detailed tables can be found on the source page in the third spreadsheet titled Current employment estimates, not seasonally adjusted.
Industry employment (covered employment)
Employment by industry reflects the rural nature of Wahkiakum County. Government is the largest employer by far, specifically local government. Agricultural, forestry, fishing and hunting industries make up a relatively large portion of the region’s employment as well as some of the highest average wages.
Employment by industry, Wahkiakum County 2024 annual average
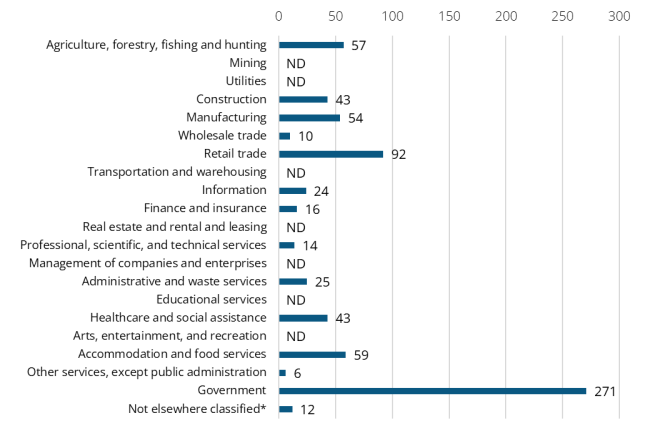
Source: Employment Security Department/Labor Market Information and Research Division, Covered Employment (QCEW)
Average annual covered employment in Wahkiakum County was 726 in 2024. This was down from 772 in 2023. Covered employment refers to workers who received wages in Washington state and are eligible for state and federal unemployment insurance (UI) compensation programs.
Government is the largest industry in the county, making up 37% of all jobs. The agriculture, forestry, fishing and hunting industry makes up about 8% of all jobs, a relatively high proportion compared to neighboring counties.
Top five sectors in terms of employment in 2024:
-
Government (271)
-
Retail trade (92)
-
Accommodation and food services (59)
-
Agriculture, forestry, fishing and hunting (57)
-
Manufacturing (54)
The average annual wage in Wahkiakum County was $45,082 in 2024. This was up from $42,910 in 2023, a 5.1% increase. Wahkiakum County had the lowest average annual wage out of Washington’s 39 counties in 2024.
Top five sectors in terms of wages in 2024:
-
Agriculture, forestry, fishing and hunting ($66,715)
-
Information ($63,033)
-
Construction ($54,126)
-
Finance and insurance ($53,894)
-
Wholesale trade ($53,461)
Workforce demographics for Wahkiakum County
Wahkiakum County is one of the smallest in the state, both in area as well as population. The 16 and over population is 3,795, with a labor force participation rate of 41.9%. This low rate is due to the large number of older residents. Estimates across different demographic groups tend to have wide margins of error due to sample size, and should be interpreted carefully.
Visit the U.S. Census Bureau website for quick facts about Wahkiakum County.
Age
| Demographic characteristic | Total | Labor force participation rate | Unemployment rate |
|---|---|---|---|
| Population 16 years and over | 3,795 | 41.9% | 2.6% |
| 16 to 19 years | 103 | 59.2% | 0.0% |
| 20 to 24 years | 199 | 75.9% | 11.3% |
| 25 to 29 years | 162 | 72.8% | 3.4% |
| 30 to 34 years | 176 | 70.5% | 0.0% |
| 35 to 44 years | 430 | 76.0% | 3.4% |
| 45 to 54 years | 454 | 59.9% | 0.0% |
| 55 to 59 years | 248 | 69.8% | 5.8% |
| 60 to 64 years | 544 | 36.6% | 0.0% |
| 65 to 74 years | 884 | 13.6% | 0.0% |
| 75 years and over | 595 | 7.4% | 0.0% |
Race or Hispanic origin
| Demographic characteristic | Total | Labor force participation rate | Unemployment rate |
|---|---|---|---|
| White alone | 3,329 | 41.6% | 0.9% |
| Black or African American alone | 13 | 0.0% | - |
| American Indian and Alaska Native alone | 4 | 50.0% | 0.0% |
| Asian alone | 80 | 62.5% | 0.0% |
| Native Hawaiian and other Pacific Islander alone | 5 | 0.0% | - |
| Some other race alone | 94 | 47.9% | 0.0% |
| Two or more races | 270 | 39.3% | 27.4% |
| Hispanic or Latino origin (of any race) | 211 | 69.2% | 11.6% |
| White alone, not Hispanic or Latino | 3,249 | 40.5% | 0.8% |
| Population 20 to 64 years | 2,213 | 61.6% | 3.1% |
Sex
| Demographic characteristic | Total | Labor force participation rate | Unemployment rate |
|---|---|---|---|
| Male | 1,046 | 70.3% | 1.5% |
| Female | 1,167 | 53.9% | 4.9% |
Females with children
| Demographic characteristic | Total | Labor force participation rate | Unemployment rate |
|---|---|---|---|
| With own children under 18 | 374 | 51.1% | 2.6% |
| With own children under 6 only | 87 | 46.0% | 0.0% |
| With own children under 6 and 6 to 17 | 112 | 41.1% | 0.0% |
| With own children 6 to 17 only | 175 | 60.0% | 4.8% |
Poverty status in the past 12 months
| Demographic characteristic | Total | Labor force participation rate | Unemployment rate |
|---|---|---|---|
| Below poverty level | 438 | 25.6% | 4.5% |
| At or above the poverty level | 1,764 | 71.0% | 3.0% |
Disability status
| Demographic characteristic | Total | Labor force participation rate | Unemployment rate |
|---|---|---|---|
| With any disability | 341 | 46.0% | 3.2% |
Educational attainment
| Demographic characteristic | Total | Labor force participation rate | Unemployment rate |
|---|---|---|---|
| Population 25 to 64 years | 2,014 | 60.2% | 2.1% |
| Less than high school graduate | 202 | 75.7% | 0.0% |
| High school graduate (includes equivalency) | 628 | 63.5% | 1.3% |
| Some college or associate's degree | 827 | 51.1% | 4.7% |
| Bachelor's degree or higher | 357 | 66.7% | 0.0% |
Source: U.S. Census Bureau, American Community Survey 5-year estimates, S2301 | Employment Status
This workforce product was funded by a grant awarded by the U.S. Department of Labor's Employment and Training Administration. The product was created by the recipient and does not necessarily reflect the official position of the U.S. Department of Labor. The Department of Labor makes no guarantees, warranties, or assurances of any kind, expressed or implied, with respect to such information, including any information on linked sites and including, but not limited to, accuracy of the information or its completeness, timeliness, usefulness, adequacy, continued availability, or ownership. This product is copyrighted by the institution that created it. Internal use by an organization and/or personal use by an individual for non-commercial purposes is permissible. All other uses require the prior authorization of the copyright owner.