

Posted October 2025
August 2025 highlights
From July to August, the not seasonally adjusted unemployment rate increased from 4.4% to 4.5% and total nonfarm employment decreased by 400 jobs.
Summary
Thurston County is home to Washington’s state capitol of Olympia, and as such, its major employer has historically been state government. While this lessened during the pandemic, many state agencies are still headquartered in Thurston County. In 2023 government employment was 42,128. Of those, 28,397 were at the state level, about 22% of all employment in the county.
Other major sectors in Thurston County include health care and social assistance, retail trade, accommodation and food services, and professional, scientific, and technical services.
Location
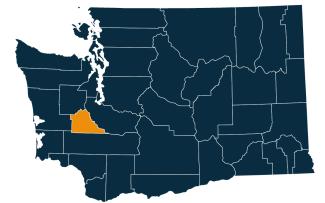
Thurston County is in the South Puget Sound region of Washington. Its largest city is the state capitol of Olympia, and it comprises the Olympia-Lacey-Tumwater Metropolitan Statistical Area (MSA). Neighboring counties are Mason County to the north, Pierce to the east, Lewis to the south and Grays Harbor to the west.
Thurston County is part of the Pacific Mountain Workforce Development Area. Visit the Workforce Training & Education Coordinating Board website for information about the 12 workforce regions.
Employment situation for August 2025
Labor force and unemployment
-
The not seasonally adjusted unemployment rate was 4.5% in August 2025, up from 4.4% in the previous month and down from 4.8% in August 2024.
-
The total civilian labor force was 142,474 in August 2025, up from 142,217 in August 2024.
-
There were 6,441 unemployed persons in August 2025, 361 fewer than in August 2024.
Unemployment rate, not seasonally adjusted
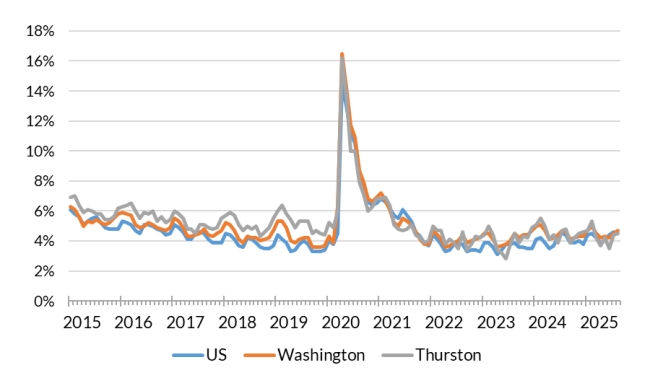
Source: Employment Security Department/Labor Market Information and Research Division, Local area unemployment statistics
Payroll employment
-
Total nonfarm employment was 131,800 in August 2025, not seasonally adjusted. This was down by 400 jobs from the previous month, and down by 300 jobs (0.2%) from August 2024.
-
Over the course of 12 months, ending in August 2025, employment increased in four industries, decreased in six industries
,and was unchanged in two industries. -
The largest increase over the year was in private education and health services (up 600 jobs), followed by other services (up 300 jobs).
-
The largest decrease over the year was in retail trade (down 500 jobs), followed by manufacturing (down 300 jobs) and financial activities (down 300 jobs).
Nonfarm employment estimates, not seasonally adjusted, Thurston County
| NAICS Industry Title | Aug 2025 (Prelim) | Jul 2025 (Revised) | Aug 2024 (Revised) | Jul 2025 to Aug 2025 Change | Aug 2024 to Aug 2025 Change | Aug 2024 to Aug 2025 % Change |
|---|---|---|---|---|---|---|
| Total nonfarm | 131,800 | 132,200 | 132,100 | -400 | -300 | -0.2% |
| Total private (total nonfarm less government) | 87,900 | 88,000 | 88,000 | -100 | -100 | -0.1% |
| Goods-producing | 10,100 | 10,100 | 10,300 | 0 | -200 | -1.9% |
| - Mining, logging and construction | 7,100 | 7,100 | 7,000 | 0 | 100 | 1.4% |
| - Manufacturing | 3,000 | 3,000 | 3,300 | 0 | -300 | -9.1% |
| Service-providing | 121,700 | 122,100 | 121,800 | -400 | -100 | -0.1% |
| - Wholesale trade | 4,300 | 4,400 | 4,300 | -100 | 0 | 0.0% |
| - Retail trade | 12,000 | 11,900 | 12,500 | 100 | -500 | -4.0% |
| - Transportation, warehousing, and utilities | 3,700 | 3,700 | 3,800 | 0 | -100 | -2.6% |
| - Information | 1,700 | 1,700 | 1,700 | 0 | 0 | 0.0% |
| - Financial activities | 4,000 | 4,000 | 4,300 | 0 | -300 | -7.0% |
| - Professional and business services | 14,900 | 14,900 | 15,000 | 0 | -100 | -0.7% |
| - Private education and health services | 20,000 | 19,900 | 19,400 | 100 | 600 | 3.1% |
| - Leisure and hospitality | 11,800 | 11,900 | 11,700 | -100 | 100 | 0.9% |
| - Other services | 5,200 | 5,200 | 4,900 | 0 | 300 | 6.1% |
| - Government | 43,900 | 44,200 | 44,100 | -300 | -200 | -0.5% |
Note: Data benchmarked through March 2025, updated September 15, 2025.
Source: Employment Security Department/Labor Market Information and Research Division, Washington employment estimates (WA-QB & CES)
Detailed tables can be found on the source page in the third spreadsheet titled Current employment estimates, not seasonally adjusted.
Industry employment (covered employment)
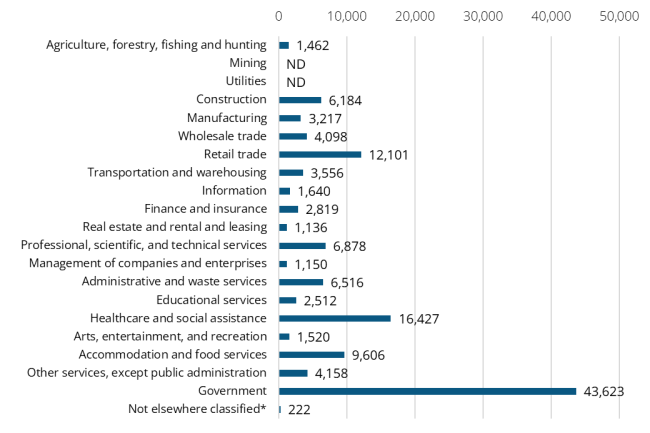
Employment by industry, Thurston County 2024 annual average
Source: Employment Security Department/Labor Market Information and Research Division, Covered Employment (QCEW)
Average annual covered employment in Thurston County was 128,824 in 2024. This was up from 126,882 in 2023. Covered employment refers to workers who received wages in Washington state and are eligible for state and federal unemployment insurance (UI) compensation programs.
Thurston County contains the state capital of Olympia, and government is by far the largest industry. Government employment was 43,623 in 2024, nearly three times bigger than the largest private sector industry (health care and social assistance, at 16,427). About two thirds of all government employment is at the state level, and state employment makes up 23% of all jobs.
Top five sectors in terms of employment in 2024:
-
Government (43,623)
-
Health care and social assistance (16,427)
-
Retail trade (12,101)
-
Accommodation and food services (9,606)
-
Professional, scientific
,and technical services (6,878)
The average annual wage in Thurston County was $72,044 in 2024. This was up from $68,201 in 2023, a 5.6% increase.
Top five sectors in terms of wages in 2024:
-
Mining and Utilities ($138,343)
-
Information ($129,655)
-
Management of companies and enterprises ($112,603)
-
Professional, scientific and technical services ($106,172)
-
Finance and insurance ($105,772)
Workforce demographics for Thurston County
Thurston County’s 16 and over population is 241,254 and 61.9% of that population is in the labor force. Unemployment and labor force participation rates vary across demographic groups. Among the working age population, men and women are unemployed at the same rate (4.9%), though more men are in the labor force (82.8% vs. 73.8%). About 37% of the population aged 25 to 64 holds a bachelor’s degree.
Visit the U.S. Census Bureau website for quick facts about Thurston County.
Age
| Demographic characteristic | Total | Labor force participation rate | Unemployment rate |
|---|---|---|---|
| Population 16 years and over | 241,254 | 61.9% | 5.2% |
| 16 to 19 years | 13,149 | 39.1% | 19.3% |
| 20 to 24 years | 16,675 | 81.5% | 9.6% |
| 25 to 29 years | 20,644 | 84.6% | 4.9% |
| 30 to 34 years | 21,806 | 77.7% | 6.0% |
| 35 to 44 years | 42,470 | 80.7% | 4.1% |
| 45 to 54 years | 35,420 | 81.9% | 3.2% |
| 55 to 59 years | 17,120 | 75.3% | 6.6% |
| 60 to 64 years | 19,646 | 60.7% | 2.4% |
| 65 to 74 years | 33,583 | 21.9% | 2.1% |
| 75 years and over | 20,741 | 4.3% | 4.4% |
Race or Hispanic origin
| Demographic characteristic | Total | Labor force participation rate | Unemployment rate |
|---|---|---|---|
| White alone | 184,683 | 60.3% | 5.0% |
| Black or African American alone | 7,816 | 67.7% | 6.8% |
| American Indian and Alaska Native alone | 2,635 | 63.6% | 8.9% |
| Asian alone | 14,826 | 63.6% | 4.6% |
| Native Hawaiian and other Pacific Islander alone | 2,356 | 76.1% | 18.6% |
| Some other race alone | 5,760 | 68.5% | 3.6% |
| Two or more races | 23,178 | 68.8% | 5.6% |
| Hispanic or Latino origin (of any race) | 21,049 | 72.0% | 5.2% |
| White alone, not Hispanic or Latino | 177,698 | 59.8% | 4.9% |
| Population 20 to 64 years | 173,781 | 78.3% | 4.9% |
Sex
| Demographic characteristic | Total | Labor force participation rate | Unemployment rate |
|---|---|---|---|
| Male | 86,277 | 82.8% | 4.9% |
| Female | 87,504 | 73.8% | 4.9% |
Females with children
| Demographic characteristic | Total | Labor force participation rate | Unemployment rate |
|---|---|---|---|
| With own children under 18 | 30,146 | 71.8% | 3.2% |
| With own children under 6 only | 6,911 | 66.5% | 2.9% |
| With own children under 6 and 6 to 17 | 5,552 | 61.5% | 3.8% |
| With own children 6 to 17 only | 17,683 | 77.1% | 3.2% |
Poverty status in the past 12 months
| Demographic characteristic | Total | Labor force participation rate | Unemployment rate |
|---|---|---|---|
| Below poverty level | 16,463 | 43.6% | 21.4% |
| At or above the poverty level | 156,054 | 82.4% | 3.9% |
Disability status
| Demographic characteristic | Total | Labor force participation rate | Unemployment rate |
|---|---|---|---|
| With any disability | 22,370 | 51.6% | 8.7% |
Educational attainment
| Demographic characteristic | Total | Labor force participation rate | Unemployment rate |
|---|---|---|---|
| Population 25 to 64 years | 157,106 | 78.0% | 4.4% |
| Less than high school graduate | 8,447 | 63.1% | 7.7% |
| High school graduate (includes equivalency) | 34,475 | 69.6% | 6.3% |
| Some college or associate's degree | 55,747 | 77.0% | 4.4% |
| Bachelor's degree or higher | 58,437 | 85.9% | 3.0% |
Source: U.S. Census Bureau, American Community Survey 5-year estimates, S2301 | Employment Status.
This workforce product was funded by a grant awarded by the U.S. Department of Labor's Employment and Training Administration. The product was created by the recipient and does not necessarily reflect the official position of the U.S. Department of Labor. The Department of Labor makes no guarantees, warranties, or assurances of any kind, expressed or implied, with respect to such information, including any information on linked sites and including, but not limited to, accuracy of the information or its completeness, timeliness, usefulness, adequacy, continued availability, or ownership. This product is copyrighted by the institution that created it. Internal use by an organization and/or personal use by an individual for non-commercial purposes is permissible. All other uses require the prior authorization of the copyright owner.