

Posted October 2025
August 2025 highlights
From July to August, the not seasonally adjusted unemployment rate remained unchanged at 5.6% and total nonfarm employment increased by 170 jobs.
Summary
Grays Harbor County is a scenic, largely rural area, owing to its location on the Pacific Ocean. Historically its major industries were in timber and fishing. While manufacturing continues to be a major industry, including seafood production, the county’s economy has shifted toward services. Tourism has also played a major role in recent years.
Local government is the largest sector, followed by health care and social assistance, accommodation and food services, retail trade, and manufacturing.
Compared to the statewide average, Grays Harbor County tends to have higher unemployment and lower average wages. During the COVID-19 pandemic, the unemployment rate hit a high of 19.6%. While unemployment has recovered to pre-pandemic levels, Grays Harbor consistently has one of the highest unemployment rates among Washington’s 39 counties.
Location
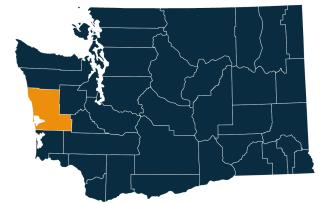
Grays Harbor County is located along the Pacific Ocean in western Washington. The county is bordered by Jefferson County to the north, Mason and Thurston counties to the east, and Pacific and Lewis counties to the south. The largest city is Aberdeen, and the county makes up the Aberdeen Micropolitan Statistical Area.
Grays Harbor County is part of the Pacific Mountain Workforce Development Area. Visit the Workforce Training & Education Coordinating Board website for information about the 12 workforce regions.
Employment situation for August 2025
Labor force and unemployment
-
The not seasonally adjusted unemployment rate was 5.6% in August 2025. This was unchanged from the previous month and down from 6.2% in August 2024.
-
The total civilian labor force was 29,631 in August 2025, with little change from 29,703 in August 2024.
-
There were 1,656 unemployed people in August 2025, 187 fewer than in August 2024.
Unemployment rate, not seasonally adjusted
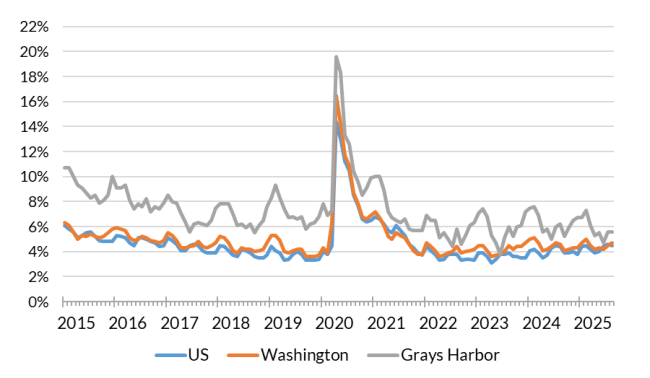
Source: Employment Security Department/Labor Market Information and Research Division, Local area unemployment statistics
Payroll employment
-
Total nonfarm employment was 24,400 in August 2025, not seasonally adjusted. This was up by 170 jobs from the previous month, and up by 280 jobs (1.2%) from August 2024.
-
Over the course of 12 months, ending in August 2025, goods producing industries lost 30 jobs (0.7%) and service providing industries added 310 jobs (1.6%).
-
The largest increase over the year was in government (up 270 jobs), followed by private education and health services (up 100 jobs).
-
The largest decrease over the year was in construction (down 70 jobs).
Nonfarm employment estimates, not seasonally adjusted, Grays Harbor County
| NAICS Industry Title | Aug 2025 (Prelim) | Jul 2025 (Revised) | Aug 2024 (Revised) | Jul 2025 to Aug 2025 Change | Aug 2024 to Aug 2025 Change | Aug 2024 to Aug 2025 % Change |
|---|---|---|---|---|---|---|
| Total nonfarm | 24,400 | 24,230 | 24,120 | 170 | 280 | 1.2% |
| Total private (total nonfarm less government) | 17,320 | 17,210 | 17,320 | 110 | 0 | 0.0% |
| Goods-producing | 4,360 | 4,350 | 4,390 | 10 | -30 | -0.7% |
| - Mining and logging | 190 | 180 | 200 | 10 | -10 | -5.0% |
| - Construction | 1,400 | 1,390 | 1,470 | 10 | -70 | -4.8% |
| - Manufacturing | 2,770 | 2,770 | 2,720 | 0 | 50 | 1.8% |
| Service-providing | 20,040 | 19,880 | 19,730 | 160 | 310 | 1.6% |
| - Wholesale trade | 510 | 520 | 510 | -10 | 0 | 0.0% |
| - Retail trade | 2,640 | 2,620 | 2,630 | 20 | 10 | 0.4% |
| - Transportation, warehousing, and utilities | 480 | 500 | 470 | -20 | 10 | 2.1% |
| - Information | 110 | 110 | 100 | 0 | 10 | 10.0% |
| - Financial activities | 780 | 780 | 790 | 0 | -10 | -1.3% |
| - Professional and business services | 1,150 | 1,140 | 1,200 | 10 | -50 | -4.2% |
| - Private education and health services | 3,380 | 3,370 | 3,280 | 10 | 100 | 3.0% |
| - Leisure and hospitality | 3,180 | 3,100 | 3,200 | 80 | -20 | -0.6% |
| - Other services | 730 | 720 | 750 | 10 | -20 | -2.7% |
| - Government | 7,070 | 7,020 | 6,800 | 50 | 270 | 4.0% |
Note: Data benchmarked through March 2025, updated September 15, 2025.
Source: Employment Security Department/Labor Market Information and Research Division, Washington employment estimates (WA-QB & CES)
Detailed tables can be found on the source page in the third spreadsheet titled Current employment estimates, not seasonally adjusted.
Industry employment (covered employment)
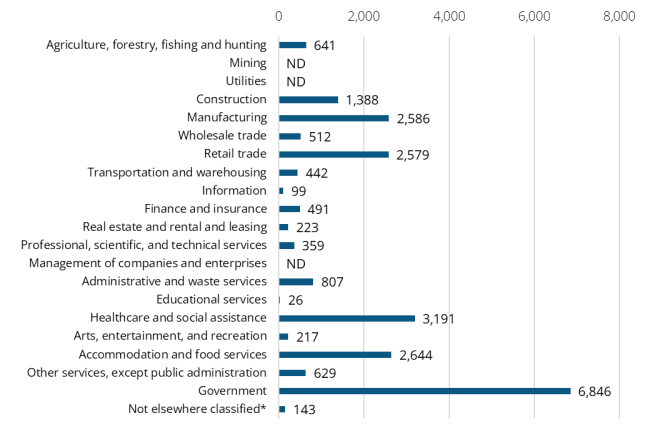
Once a center for forestry and other goods producing sectors, the economy in Grays Harbor County has shifted towards services. Local government is the largest source of employment. In the private sector, the next largest major industries are split evenly between health care and social assistance, accommodation and food services, retail trade, and manufacturing.
Employment by industry, Grays Harbor County 2024 annual average
Source: Employment Security Department/Labor Market Information and Research Division, Covered Employment (QCEW)
Average annual covered employment in Grays Harbor County was 23,820 in 2024. This was up from 23,424 in 2023. Covered employment refers to workers who received wages in Washington state and are eligible for state and federal unemployment insurance (UI) compensation programs.
Top five sectors in terms of employment in 2024:
-
Government (6,846)
-
Health care and social assistance (3,191)
-
Accommodation and food services (2,644)
-
Manufacturing (2,586)
-
Retail trade (2,579)
The average annual wage in Grays Harbor County was $56,795 in 2024. This was up from $53,952 in 2023, a 5.3% increase.
Top five sectors in terms of wages in 2024:
-
Transportation and warehousing ($93,597)
-
Mining, Utilities and Management of companies and enterprises ($92,822)
-
Professional, scientific and technical services ($78,490)
-
Construction ($75,796)
-
Information ($75,152)
Workforce demographics for Grays Harbor County
Grays Harbor County’s working age (16 and over) population is just under 63,000. The labor force participation rate is 50.9%, lower than the state average. Among the population aged 20 to 64, men and women have similar rates of labor force participation (66.2% and 69.2%) and unemployment (6.9% and 6.5%). Visit the U.S. Census Bureau website for quick facts about Grays Harbor County.
Age
| Demographic characteristic | Total | Labor force participation rate | Unemployment rate |
|---|---|---|---|
| Population 16 years and over | 62,918 | 50.9% | 6.6% |
| 16 to 19 years | 3,388 | 31.4% | 16.3% |
| 20 to 24 years | 3,529 | 76.7% | 6.2% |
| 25 to 29 years | 4,287 | 73.7% | 6.6% |
| 30 to 34 years | 4,641 | 76.5% | 12.1% |
| 35 to 44 years | 9,176 | 68.1% | 8.1% |
| 45 to 54 years | 8,948 | 71.8% | 4.9% |
| 55 to 59 years | 5,231 | 61.4% | 4.0% |
| 60 to 64 years | 6,280 | 50.2% | 4.5% |
| 65 to 74 years | 11,104 | 18.5% | 1.8% |
| 75 years and over | 6,334 | 7.3% | 1.9% |
Race or Hispanic origin
| Demographic characteristic | Total | Labor force participation rate | Unemployment rate |
|---|---|---|---|
| White alone | 52,516 | 49.8% | 6.8% |
| Black or African American alone | 1,030 | 18.0% | 12.4% |
| American Indian and Alaska Native alone | 2,448 | 47.9% | 5.6% |
| Asian alone | 826 | 64.9% | 0.0% |
| Native Hawaiian and other Pacific Islander alone | 309 | 60.5% | 3.2% |
| Some other race alone | 1,537 | 74.2% | 2.6% |
| Two or more races | 4,252 | 62.2% | 7.9% |
| Hispanic or Latino origin (of any race) | 5,124 | 66.4% | 6.7% |
| White alone, not Hispanic or Latino | 50,651 | 49.4% | 6.6% |
| Population 20 to 64 years | 42,092 | 67.6% | 6.7% |
Sex
| Demographic characteristic | Total | Labor force participation rate | Unemployment rate |
|---|---|---|---|
| Male | 22,421 | 66.2% | 6.9% |
| Female | 19,671 | 69.2% | 6.5% |
Females with children
| Demographic characteristic | Total | Labor force participation rate | Unemployment rate |
|---|---|---|---|
| With own children under 18 | 6,046 | 73.4% | 6.4% |
| With own children under 6 only | 1,220 | 73.2% | 13.0% |
| With own children under 6 and 6 to 17 | 1,357 | 65.5% | 0.4% |
| With own children 6 to 17 only | 3,469 | 76.5% | 6.2% |
Poverty status in the past 12 months
| Demographic characteristic | Total | Labor force participation rate | Unemployment rate |
|---|---|---|---|
| Below poverty level | 5,481 | 38.6% | 29.7% |
| At or above the poverty level | 34,332 | 76.7% | 4.8% |
Disability status
| Demographic characteristic | Total | Labor force participation rate | Unemployment rate |
|---|---|---|---|
| With any disability | 7,162 | 39.2% | 15.6% |
Educational attainment
| Demographic characteristic | Total | Labor force participation rate | Unemployment rate |
|---|---|---|---|
| Population 25 to 64 years | 38,563 | 66.8% | 6.7% |
| Less than high school graduate | 4,146 | 61.9% | 13.7% |
| High school graduate (includes equivalency) | 13,747 | 57.6% | 10.5% |
| Some college or associate's degree | 14,388 | 70.8% | 4.2% |
| Bachelor's degree or higher | 6,282 | 80.8% | 2.3% |
Source: U.S. Census Bureau, American Community Survey 5-year estimates, S2301 | Employment Status
This workforce product was funded by a grant awarded by the U.S. Department of Labor's Employment and Training Administration. The product was created by the recipient and does not necessarily reflect the official position of the U.S. Department of Labor. The Department of Labor makes no guarantees, warranties, or assurances of any kind, expressed or implied, with respect to such information, including any information on linked sites and including, but not limited to, accuracy of the information or its completeness, timeliness, usefulness, adequacy, continued availability, or ownership. This product is copyrighted by the institution that created it. Internal use by an organization and/or personal use by an individual for non-commercial purposes is permissible. All other uses require the prior authorization of the copyright owner.