

Posted October 2025
August 2025 highlights
The unemployment rate in the county was 4.0% in August 2025, which decreased from 4.4% in July 2025 and decreased from 4.3% in August 2024. Overall job trends show Garfield County had total nonfarm employment of 680 jobs, reflecting a 1.4% decrease, with 10 jobs decline compared to August 2024.
Summary
Garfield County’s economy has continued to show resilience and modest growth through 2024, driven by the enduring strength of government services and agriculture. Employment figures have been on an upward trajectory, with job numbers rising from 645 in 2021 to 654 in 2024. Total payroll expanded from $34.2 million to $39.76 million during the same period. Concurrently, average annual wages have seen a steady increase from $55,565 to $60,801.
Agriculture remains a vital economic pillar, benefiting from favorable weather conditions and increased demand for local produce. These factors contributed to higher crop yields and boosted farmer revenues in 2024. Additionally, Garfield County advanced several infrastructure projects aimed at improving transportation and digital connectivity. These initiatives are expected to generate new employment opportunities and stimulate further economic activity.
Together, these developments highlight Garfield County’s proactive approach to fostering a dynamic and evolving economic landscape, with a focus on sustainability, workforce development and regional competitiveness.
Garfield County geographic overview
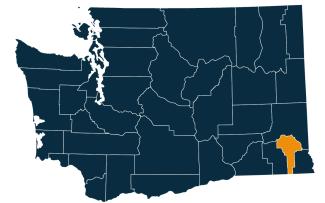
Garfield County is in the southeastern part of Washington. It is the least populous county in the state. The town of Pomeroy is the county seat and the largest city in the county. Garfield County’s population was 2,286 in the 2020 census. In 2022, the Census estimated the population at 2,363, which is 3.4% growth from the 2020 census.
The county covers 718 square miles, including 7.5 square miles of water. It features a mix of agricultural land and rolling prairie-like terrain.
Garfield County was created out of Columbia County in 1881 and was named after President James A. Garfield.
Washington has 12 regional Workforce Development Areas. Garfield County is part of Area 10, the Eastern Washington Partnership. Visit the Workforce Training & Education Coordinating Board website for information about the workforce regions.
Garfield County employment situation for August 2025
Monthly labor force and unemployment
-
As of August 2025, Garfield County total labor force, employment and unemployment decreased since August 2024.
-
Garfield County has more than 843 people in the labor force, with a decrease of 3.0% or 26 workers from August 2024, employed workforce decreased by 2.8% or 23 workers and unemployed workers decreased by 8.1% or 3 workers. About 34 people were unemployed and looking for work.
-
The unemployment rate in the county was 4.0% in August 2025, which decreased from 4.4% in July 2025 and decreased from 4.3% in August 2024.
Unemployment rate, not seasonally adjusted
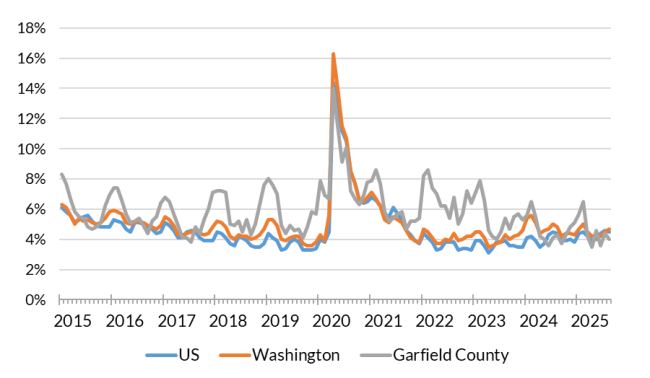
Source: Employment Security Department/Labor Market Information and Research Division, Local area unemployment statistics
Monthly nonfarm payroll employment in Garfield County
-
Overall job trends show Garfield County had total nonfarm employment of 680 jobs, reflecting a 1.4% decrease, with 10 jobs decline compared to August 2024. The private sector increased by 10 jobs or 5.6%, year-over-year, while government employment decreased by 3.9%, or 20 jobs.
-
There were no notable changes for industries with growth.
-
Industries facing declines include wholesale trade, which dropped by 12.5%, shedding 10 jobs.
-
Government employment with 490 total jobs decreased by 20 jobs (3.9%), with federal and state government declining 10 jobs each, 6.7% and 33.3% respectfully. State government remained unchanged.
Nonfarm employment estimates, not seasonally adjusted, Garfield County
| NAICS Industry Title | Aug 2025 (Prelim) | Jul 2025 (Revised) | Aug 2024 (Revised) | Jul 2025 to Aug 2025 Change | Aug 2024 to Aug 2025 Change | Aug 2024 to Aug 2025 % Change |
|---|---|---|---|---|---|---|
| Total nonfarm | 680 | 670 | 690 | 10 | -10 | -1.4% |
| Total private (total nonfarm less government) | 190 | 180 | 180 | 10 | 10 | 5.6% |
| Goods-producing | 10 | 10 | 10 | 0 | 0 | 0.0% |
| - Mining, logging and construction | 10 | 10 | 10 | 0 | 0 | 0.0% |
| Service-providing | 660 | 660 | 680 | 0 | -20 | -2.9% |
| - Wholesale trade | 70 | 70 | 80 | 0 | -10 | -12.5% |
| - Retail trade | 20 | 20 | 20 | 0 | 0 | 0.0% |
| - Transportation, warehousing, and utilities | 10 | 10 | 10 | 0 | 0 | 0.0% |
| - Financial activities | 10 | 10 | 10 | 0 | 0 | 0.0% |
| - Private education and health services | 30 | 30 | 30 | 0 | 0 | 0.0% |
| - Other services | 10 | 10 | 10 | 0 | 0 | 0.0% |
| - Government | 490 | 490 | 510 | 0 | -20 | -3.9% |
Note: Data benchmarked through March 2025, updated September 15, 2025.
Source: Employment Security Department/Labor Market Information and Research Division, Washington employment estimates (WA-QB & CES)
Detailed tables can be found on the source page in the third spreadsheet titled Current employment estimates, not seasonally adjusted.
Total covered employment in Garfield County
Average annual covered employment in Garfield County was 654. Covered employment refers to workers who received wages in Washington state and are eligible for state and federal unemployment insurance (UI) compensation programs.
Wages totaled $39.76 million with an average annual wage of $60,801.
The government sector was the dominant employer with 463 employees earning an average wage of $65,742. Agriculture, forestry, fishing and hunting employed 27 individuals with an average wage of $40,207. Wholesale trade was another significant sector, employing 72 people with an average wage of $55,125. The smaller retail trade sector employed 25 people with an average wage of $25.114.
Several sectors, including mining, manufacturing and various service industries, reported no employment or wages, indicating limited diversification in the county’s economic activities. Overall, Garfield County’s employment landscape is heavily reliant on government and agriculture.
Employment by industry, Garfield County 2024 annual average
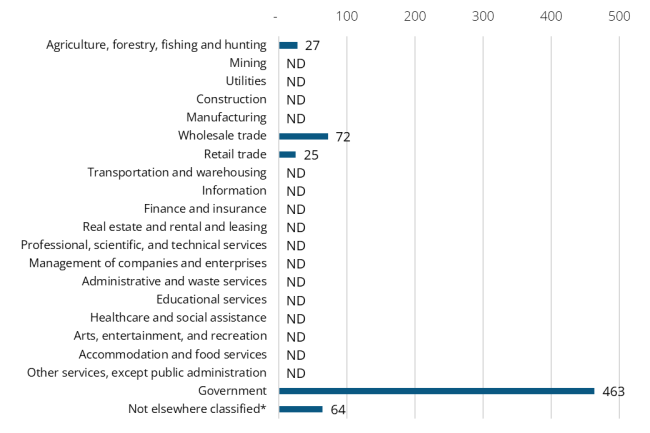
Source: Employment Security Department/Labor Market Information and Research Division, Covered Employment (QCEW)
Top four sectors in terms of employment in 2024:
-
Government (463 jobs and 70.9% employment share)
-
Wholesale trade (72 jobs or 11.0% employment share)
-
Agriculture (29 jobs or 4.4% employment share)
-
Retail trade (25 jobs or 3.8% employment share)
Wages can vary substantially from one industry sector to another. The average annual wage in Garfield County for all industries was $60,907, with $38.71 million in total payroll in 2024.
Top four sectors in terms of wages in 2024:
-
Government ($65,742)
-
Wholesale trade ($55,125)
-
Agriculture ($40,207)
-
Retail trade ($25,114)
Workforce demographics in Garfield County
The labor force participation rate is highest among the 30-34 age group at 95.0%, while the 65-74 age group has the lowest at 14.8%. Labor force participation rate for 20 to 64 years of age was 70.0%.
Male workers have a slightly higher participation rate (78.5%) compared to female workers (60.6%). People with a bachelor’s degree or higher have the highest participation rate at 85.6%, while those with a high school diploma have the lowest at 51.7%.
Visit the U.S. Census Bureau website for quick facts about Garfield County.
Age
| Demographic characteristic | Total | Labor force participation rate | Unemployment rate |
|---|---|---|---|
| Population 16 years and over | 2,008 | 48.4% | 42.3% |
| 16 to 19 years | 182 | 39.0% | 0.0% |
| 20 to 24 years | 74 | 64.9% | 0.0% |
| 25 to 29 years | 63 | 58.7% | 17.9% |
| 30 to 34 years | 100 | 95.0% | 5.2% |
| 35 to 44 years | 239 | 80.3% | 9.4% |
| 45 to 54 years | 279 | 60.9% | 0.0% |
| 55 to 59 years | 94 | 76.6% | 0.0% |
| 60 to 64 years | 288 | 63.2% | 0.0% |
| 65 to 74 years | 447 | 14.8% | 0.0% |
| 75 years and over | 242 | 16.1% | 37.5% |
Race or Hispanic origin
| Demographic characteristic | Total | Labor force participation rate | Unemployment rate |
|---|---|---|---|
| White alone | 1,844 | 47.3% | 5.8% |
| Black or African American alone | 4 | 100.0% | 100.0% |
| American Indian and Alaska Native alone | 1 | 0.0% | 0.0% |
| Asian alone | 25 | 100.0% | 0.0% |
| Native Hawaiian and other Pacific Islander alone | 0 | 0.0% | 0.0% |
| Some other race alone | 16 | 100.0% | 0.0% |
| Two or more races | 118 | 45.8% | 33.3% |
| Hispanic or Latino origin (of any race) | 56 | 33.9% | 0.0% |
| White alone, not Hispanic or Latino | 1,823 | 47.7% | 5.9% |
| Population 20 to 64 years | 1,137 | 70.0% | 5.4% |
Sex
| Demographic characteristic | Total | Labor force participation rate | Unemployment rate |
|---|---|---|---|
| Male | 596 | 78.5% | 4.5% |
| Female | 541 | 60.6% | 6.7% |
Females with children
| Demographic characteristic | Total | Labor force participation rate | Unemployment rate |
|---|---|---|---|
| With own children under 18 | 213 | 64.8% | 7.2% |
| With own children under 6 only | 51 | 47.1% | 0.0% |
| With own children under 6 and 6 to 17 | 59 | 100.0% | 0.0% |
| With own children 6 to 17 only | 103 | 53.4% | 18.2% |
Poverty status in the past 12 months
| Demographic characteristic | Total | Labor force participation rate | Unemployment rate |
|---|---|---|---|
| Below poverty level | 135 | 39.3% | 39.6% |
| At or above the poverty level | 991 | 75.0% | 3.0% |
Disability status
| Demographic characteristic | Total | Labor force participation rate | Unemployment rate |
|---|---|---|---|
| With any disability | 244 | 43.4% | 16.0% |
Educational attainment
| Demographic characteristic | Total | Labor force participation rate | Unemployment rate |
|---|---|---|---|
| Population 25 to 64 years | 1,063 | 70.4% | 5.7% |
| Less than high school graduate | 89 | 51.7% | 0.0% |
| High school graduate (includes equivalency) | 228 | 63.2% | 14.6% |
| Some college or associate's degree | 469 | 68.4% | 6.9% |
| Bachelor's degree or higher | 277 | 85.6% | 0.0% |
Source: U.S. Census Bureau, American Community Survey 5-year estimates, S2301 | Employment Status
This workforce product was funded by a grant awarded by the U.S. Department of Labor's Employment and Training Administration. The product was created by the recipient and does not necessarily reflect the official position of the U.S. Department of Labor. The Department of Labor makes no guarantees, warranties, or assurances of any kind, expressed or implied, with respect to such information, including any information on linked sites and including, but not limited to, accuracy of the information or its completeness, timeliness, usefulness, adequacy, continued availability, or ownership. This product is copyrighted by the institution that created it. Internal use by an organization and/or personal use by an individual for non-commercial purposes is permissible. All other uses require the prior authorization of the copyright owner.