
Posted May 2025
April 2025 Highlights
In April, the not seasonally adjusted unemployment rate decreased from 5.1% to 4.6% and total nonfarm employment increased by 100 jobs.
Summary
Timber and wood products have historically been a large part of Cowlitz County’s economy. The industry has declined statewide as paper mills have consolidated, but several firms are still operating in Longview. Manufacturing is Cowlitz County’s top industry, and it provides some of the area’s highest wages.
Since the pandemic, nonfarm employment in Cowlitz County has recovered and even surpassed its pre-COVID-19 levels. Employment growth has been slow but steady, though the unemployment rate is consistently higher than the statewide rate.
Location
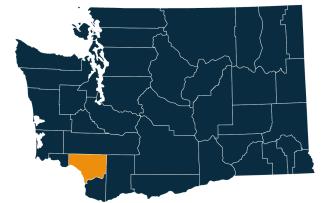
Cowlitz County is in the southwest region of Washington, along the Columbia River. It borders the larger Clark County in the south, and in many ways is an extension of the Portland-Vancouver-Hillsboro employment base. The region is well connected, located along the Interstate 5 corridor and with major ports to maritime traffic.
Longview is the area’s largest city, and the county comprises the Longview, WA Metropolitan Statistical Area (MSA).
Cowlitz County, along with neighboring Clark and Wahkiakum counties, is part of Washington’s seventh Workforce Development Area. Visit the Workforce Training & Education Coordinating Board website for information about the 12 regions.
Employment situation for April 2025
Labor force and unemployment
-
The not seasonally adjusted unemployment rate was 4.6% in April 2025, down from 5.1% in the previous month and down from 4.7% in April 2024.
-
The total civilian labor force was 47,578 in April 2025, up from 46,734 in April 2024.
-
The number of unemployed persons was 2,206 in April 2025; little changed from April 2024.
Unemployment rate, not seasonally adjusted
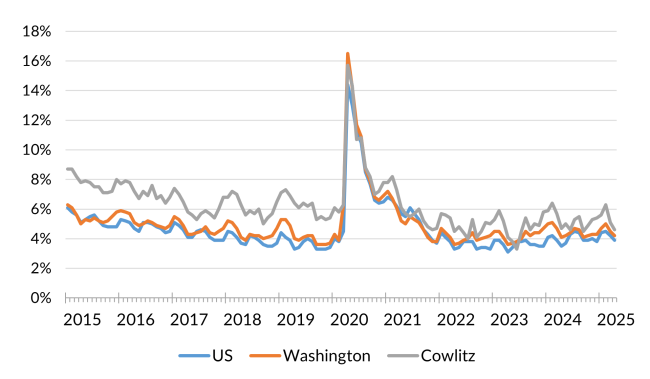
Source: Employment Security Department/Labor Market Information and Research Division, Local area unemployment statistics
Payroll employment
-
Total nonfarm employment was 42,700 in April 2025, not seasonally adjusted. This was up by 100 jobs from the previous month and up by 800 jobs (1.9%) from April 2024.
-
Over the year, goods producing industries added 400 jobs (3.6%) and service providing industries added 400 jobs (1.3%).
-
The largest over the year increases were in private education and health services (400 jobs), mining, logging, and construction (200 jobs) and manufacturing (200 jobs).
-
Trade, transportation, and utilities decreased by 300 jobs over the year, 100 of which were in retail trade. Professional and business services and leisure and hospitality each decreased by 200 jobs over the year.
Nonfarm employment estimates, not seasonally adjusted, Cowlitz County
| NAICS Industry Title | Apr 2025 (Prelim) | Mar 2025 (Revised) | Apr 2024 (Revised) | Mar 2025 to Apr 2025 Change | Apr 2024 to Apr 2025 Change | Apr 2024 to Apr 2025 % Change |
|---|---|---|---|---|---|---|
| Total nonfarm | 42,700 | 42,600 | 41,900 | 100 | 800 | 1.9% |
| Total private (total nonfarm less government) | 36,000 | 35,800 | 35,300 | 200 | 700 | 2.0% |
| Goods-producing | 11,500 | 11,600 | 11,100 | -100 | 400 | 3.6% |
| - Mining, logging and construction | 4,100 | 3,900 | 3,900 | 200 | 200 | 5.1% |
| - Manufacturing | 7,400 | 7,700 | 7,200 | -300 | 200 | 2.8% |
| Service-providing | 31,200 | 31,000 | 30,800 | 200 | 400 | 1.3% |
| - Trade, transportation, and utilities | 7,600 | 7,700 | 7,900 | -100 | -300 | -3.8% |
| - - Retail trade | 4,900 | 5,000 | 5,000 | -100 | -100 | -2.0% |
| - Professional and business services | 2,700 | 2,500 | 2,900 | 200 | -200 | -6.9% |
| - Private education and health services | 7,200 | 7,000 | 6,800 | 200 | 400 | 5.9% |
| - Leisure and hospitality | 3,300 | 3,200 | 3,500 | 100 | -200 | -5.7% |
| - Government | 6,700 | 6,800 | 6,600 | -100 | 100 | 1.5% |
Note: Data benchmarked through December 2024, updated May 16, 2025.
Source: Employment Security Department/Labor Market Information and Research Division, Washington employment estimates (WA-QB & CES)
Detailed tables can be found on the source page in the third spreadsheet titled Current employment estimates, not seasonally adjusted.
Industry employment (covered employment)
Cowlitz County has a strong manufacturing presence, both in terms of overall employment as well as average annual wages. Another important sector is trade, transportation and warehousing, due to the county’s location on Interstate 5 and the Columbia River. Within the service providing sector, health care and social assistance continues to be a major employer in the region.
Employment by industry, Cowlitz County 2023 annual average
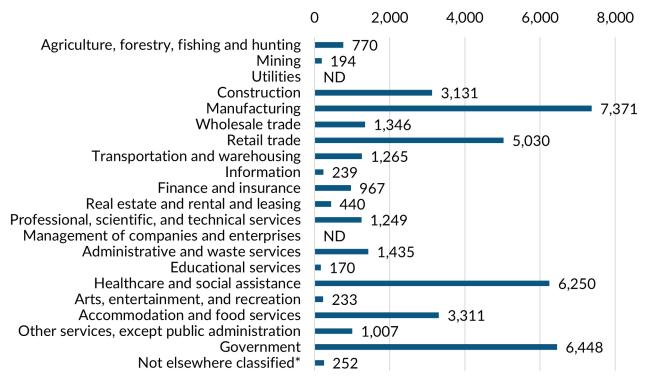
Source: Employment Security Department/Labor Market Information and Research Division, Covered Employment (QCEW)
Note: ND stands for not disclosed. ND is used to avoid disclosing data for individual employers. Industries labeled ND are grouped in the Not elsewhere classified category.
Average annual covered employment in Cowlitz County was 41,108 in 2023. Covered employment refers to workers who received wages in Washington state and are eligible for state and federal unemployment insurance (UI) compensation programs.
Top five sectors in terms of employment in 2023:
- Manufacturing (7,371)
- Government (6,448)
- Health care and social assistance (6,250)
- Retail trade (5,030)
- Accommodation and food services (3,311)
Wages can vary substantially from one industry sector to another. The average annual wage in Cowlitz County for all industries was $64,444 in 2023.
Top five sectors in terms of wage in 2023:
- Transportation and warehousing ($131,166)
- Professional, scientific, and technical services ($90,323)
- Mining ($87,657)
- Manufacturing ($82,429)
- Finance and insurance ($80,297)
Workforce demographics for Cowlitz County
Cowlitz County has a working age population of approximately 90,000. Labor force participation is lower than the state average, due to an aging workforce. Employment status varies slightly across demographic groups. Compared to men, women have lower labor force participation (66.4% vs. 76.4%) and higher unemployment (6.7% vs. 3.2%). About 58% of the population aged 25 to 64 has some college education. Visit the U.S. Census Bureau website for quick facts about Cowlitz County.
Age
| Demographic characteristic | Total | Labor force participation rate | Unemployment rate |
|---|---|---|---|
| Population 16 years and over | 89,190 | 55.3% | 5.1% |
| 16 to 19 years | 5,135 | 42.2% | 16.4% |
| 20 to 24 years | 6,068 | 75.3% | 7.7% |
| 25 to 29 years | 6,808 | 80.2% | 5.8% |
| 30 to 34 years | 7,386 | 76.1% | 4.4% |
| 35 to 44 years | 13,610 | 78.0% | 4.5% |
| 45 to 54 years | 13,279 | 74.3% | 3.9% |
| 55 to 59 years | 7,380 | 63.3% | 3.8% |
| 60 to 64 years | 7,762 | 47.4% | 5.3% |
| 65 to 74 years | 13,087 | 17.8% | 1.5% |
| 75 years and over | 8,675 | 3.9% | 0.0% |
Race or Hispanic origin
| Demographic characteristic | Total | Labor force participation rate | Unemployment rate |
|---|---|---|---|
| White alone | 77,309 | 54.8% | 4.9% |
| Black or African American alone | 606 | 69.0% | 17.5% |
| American Indian and Alaska Native alone | 962 | 53.0% | 22.2% |
| Asian alone | 1,203 | 45.6% | 1.6% |
| Native Hawaiian and other Pacific Islander alone | 248 | 48.4% | 0.0% |
| Some other race alone | 2,165 | 67.8% | 8.7% |
| Two or more races | 6,697 | 58.3% | 3.9% |
| Hispanic or Latino origin (of any race) | 7,358 | 72.0% | 4.4% |
| White alone, not Hispanic or Latino | 74,336 | 53.9% | 5.1% |
| Population 20 to 64 years | 62,293 | 71.4% | 4.8% |
Sex
| Demographic characteristic | Total | Labor force participation rate | Unemployment rate |
|---|---|---|---|
| Male | 31,272 | 76.4% | 3.2% |
| Female | 31,021 | 66.4% | 6.7% |
Females with children
| Demographic characteristic | Total | Labor force participation rate | Unemployment rate |
|---|---|---|---|
| With own children under 18 | 10,655 | 69.0% | 6.7% |
| With own children under 6 only | 2,205 | 62.4% | 1.6% |
| With own children under 6 and 6 to 17 | 2,285 | 59.5% | 3.9% |
| With own children 6 to 17 only | 6,165 | 74.9% | 9.0% |
Poverty status in the past 12 months
| Demographic characteristic | Total | Labor force participation rate | Unemployment rate |
|---|---|---|---|
| Below poverty level | 8,376 | 34.5% | 19.3% |
| At or above the poverty level | 53,639 | 77.6% | 3.8% |
Disability status
| Demographic characteristic | Total | Labor force participation rate | Unemployment rate |
|---|---|---|---|
| With any disability | 11,424 | 41.6% | 12.4% |
Educational attainment
| Demographic characteristic | Total | Labor force participation rate | Unemployment rate |
|---|---|---|---|
| Population 25 to 64 years | 56,225 | 71.0% | 4.5% |
| Less than high school graduate | 6,018 | 57.8% | 7.1% |
| High school graduate (includes equivalency) | 17,481 | 65.7% | 3.9% |
| Some college or associate's degree | 23,669 | 76.1% | 5.1% |
| Bachelor's degree or higher | 9,057 | 76.7% | 2.7% |
Source: U.S. Census Bureau, American Community Survey 5-year estimates, S2301 | Employment Status
This workforce product was funded by a grant awarded by the U.S. Department of Labor's Employment and Training Administration. The product was created by the recipient and does not necessarily reflect the official position of the U.S. Department of Labor. The Department of Labor makes no guarantees, warranties, or assurances of any kind, expressed or implied, with respect to such information, including any information on linked sites and including, but not limited to, accuracy of the information or its completeness, timeliness, usefulness, adequacy, continued availability, or ownership. This product is copyrighted by the institution that created it. Internal use by an organization and/or personal use by an individual for non-commercial purposes is permissible. All other uses require the prior authorization of the copyright owner.