

August 2025 highlights
The not seasonally adjusted unemployment rate was 4.6% in August. The nonfarm employment job count was 25,380, up 90 jobs over the month.
Summary
Clallam County has 30,550 workers in its labor force for August 2025. The not seasonally adjusted unemployment rate remains low at 4.6%. The unemployment rate was 4.5% a month ago. Total nonfarm employment was 25,380 jobs, up 90 jobs over the month and 30 jobs below August 2024. There were approximately 108 initial claim filings for unemployment insurance during the month.
Location

Clallam County occupies a long and narrow area in the most northwestern corner of Washington state. Encompassing part of the Olympic Peninsula, the county includes 1,738 square miles of mostly forested and mountainous land. Clallam County is full of natural wonders, and many tourists and locals visit the Olympic National Park, which attracted more than 2.7 million visitors in 2021.
The region's 200 miles of coastline fosters maritime and fishing industries. Traditionally, much of the economy of the county has reflected this natural abundance with jobs in forestry, wood products and fisheries. As demand has declined for goods-producing and agricultural products in the county, the service sector, including leisure and tourism, has grown in their place.
Clallam County is part of the Olympic Workforce Development Area. Visit the Workforce Training & Education Coordinating Board website for information about the 12 regions.
Employment situation for August 2025
Monthly labor force and unemployment
-
The not seasonally adjusted unemployment rate was 4.6% in August 2025, below 5.3% in August 2024 and above 4.5% in July 2025.
- The labor force was 30,550 workers, 437 workers below August 2024, and 566 above July 2025.
Unemployment rate, not seasonally adjusted
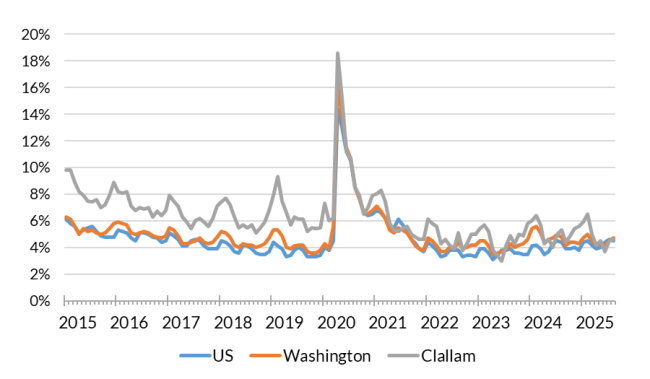
Source: Employment Security Department/Labor Market Information and Research Division, Local area unemployment statistics
Payroll employment in Clallam County
- Total nonfarm employment gained 90 jobs last month and was 30 jobs below last year.
- Goods producing industry jobs, at 2,680 jobs, gained 20 jobs over the month and was 30 jobs higher than last year.
- Trade, transportation and utilities industry jobs were unchanged over the month and was 220 jobs below last year.
- Within the trade, transportation and utilities industry, retail trade gained 10 jobs over the month and was 190 jobs below last year.
- Professional and business services gained 20 jobs over the month and was 60 jobs below last year.
- Private education and health services gained 40 jobs over the month and was 90 jobs above last year.
Nonfarm employment estimates, not seasonally adjusted, Clallam County
| NAICS Industry Title | Aug 2025 (Prelim) | Jul 2025 (Revised) | Aug 2024 (Revised) | Jul 2025 to Aug 2025 Change | Aug 2024 to Aug 2025 Change | Aug 2024 to Aug 2025 % Change |
|---|---|---|---|---|---|---|
| Total nonfarm | 25,380 | 25,290 | 25,410 | 90 | -30 | -0.1% |
| Total private (total nonfarm less government) | 16,700 | 16,570 | 16,980 | 130 | -280 | -1.6% |
| Goods-producing | 2,680 | 2,660 | 2,650 | 20 | 30 | 1.1% |
| - Mining and logging | 360 | 360 | 350 | 0 | 10 | 2.9% |
| - Construction | 1,200 | 1,180 | 1,220 | 20 | -20 | -1.6% |
| - Manufacturing | 1,120 | 1,120 | 1,080 | 0 | 40 | 3.7% |
| Service-providing | 22,700 | 22,640 | 22,760 | 60 | -60 | -0.3% |
| - Wholesale trade | 320 | 310 | 310 | 10 | 10 | 3.2% |
| - Retail trade | 3,260 | 3,250 | 3,450 | 10 | -190 | -5.5% |
| - Transportation, warehousing, and utilities | 440 | 450 | 480 | -10 | -40 | -8.3% |
| - Information | 180 | 180 | 180 | 0 | 0 | 0.0% |
| - Financial activities | 640 | 650 | 660 | -10 | -20 | -3.0% |
| - Professional and business services | 1,810 | 1,790 | 1,870 | 20 | -60 | -3.2% |
| - Private education and health services | 3,410 | 3,370 | 3,320 | 40 | 90 | 2.7% |
| - Leisure and hospitality | 3,130 | 3,090 | 3,220 | 40 | -90 | -2.8% |
| - Other services | 830 | 820 | 830 | 10 | 0 | 0.0% |
| - Government | 8,680 | 8,720 | 8,440 | -40 | 240 | 2.8% |
Note: Data benchmarked through March 2025, updated September 15, 2025
Source: Employment Security Department/Labor Market Information and Research Division, Washington employment estimates (WA-QB & CES)
Detailed tables can be found on the source page in the third spreadsheet titled Current employment estimates, not seasonally adjusted.
Industry employment (covered employment) in Clallam County
Employment by industry, Clallam County 2024 annual average
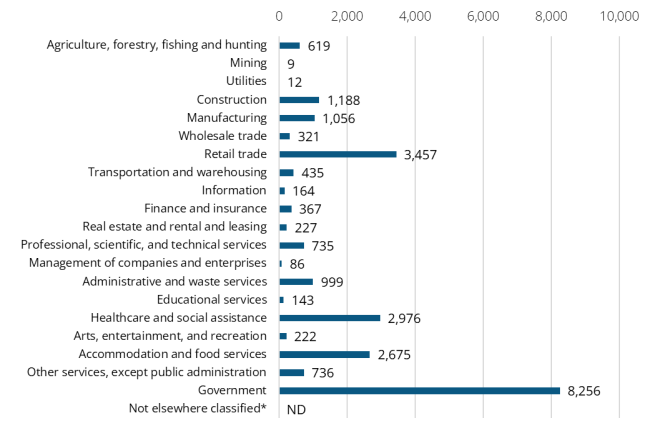
Source: Employment Security Department/Labor Market Information and Research Division, Covered Employment (QCEW)
Average annual covered employment in Clallam County was 24,683 in 2024. Covered employment refers to workers who received wages in Washington state and are eligible for state and federal unemployment insurance (UI) compensation programs.
The average annual wage in Washington state for all industries was $92,467 in 2024. The average annual wage in Clallam County was $55,854 in 2024.
Top sectors in terms of average annual employment in 2024:
- Government (8,256)
- Retail trade (3,457)
- Health care and social assistance (2,976)
- Accommodation and food services (2,675)
- Construction (1,188)
The top sectors in terms of annual average wages in 2024:
- Finance and insurance ($81,954)
- Information ($81,353)
- Management of companies and enterprises ($77,444)
- Professional, scientific and technical services ($73,114)
- Government ($70,827)
Workforce demographics in Clallam County
Visit the U.S. Census Bureau website for more quick facts about Clallam County.
Age
| Demographic characteristic | Total | Labor force participation rate | Unemployment rate |
|---|---|---|---|
| Population 16 years and over | 66,470 | 47.8% | 6.0% |
| 16 to 19 years | 2,830 | 40.1% | 18.3% |
| 20 to 24 years | 3,078 | 72.6% | 12.7% |
| 25 to 29 years | 3,733 | 82.2% | 8.8% |
| 30 to 34 years | 4,301 | 73.1% | 5.4% |
| 35 to 44 years | 8,622 | 77.7% | 5.4% |
| 45 to 54 years | 7,550 | 73.6% | 4.1% |
| 55 to 59 years | 4,598 | 60.4% | 6.0% |
| 60 to 64 years | 7,332 | 51.8% | 3.2% |
| 65 to 74 years | 14,569 | 19.0% | 3.3% |
| 75 years and over | 9,857 | 5.9% | 2.2% |
Race and Hispanic or Latino origin
| Demographic characteristic | Total | Labor force participation rate | Unemployment rate |
|---|---|---|---|
| White alone | 56,363 | 46.0% | 5.7% |
| Black or African American alone | 551 | 49.4% | 0.0% |
| American Indian and Alaska Native alone | 2,141 | 59.8% | 10.5% |
| Asian alone | 1,232 | 64.4% | 7.4% |
| Native Hawaiian and other Pacific Islander alone | 33 | 42.4% | 0.0% |
| Some other race alone | 1,246 | 65.7% | 5.8% |
| Two or more races | 4,904 | 54.0% | 6.7% |
| Hispanic or Latino origin (of any race) | 3,477 | 62.8% | 6.3% |
| White alone, not Hispanic or Latino | 55,360 | 45.7% | 5.6% |
| Population 20 to 64 years | 39,214 | 69.6% | 5.8% |
Sex
| Demographic characteristic | Total | Labor force participation rate | Unemployment rate |
|---|---|---|---|
| Male | 19,591 | 71.8% | 6.3% |
| Female | 19,623 | 67.4% | 5.3% |
Females with children
| Demographic characteristic | Total | Labor force participation rate | Unemployment rate |
|---|---|---|---|
| With own children under 18 | 5,604 | 71.6% | 3.7% |
| With own children under 6 only | 1,133 | 55.1% | 5.3% |
| With own children under 6 and 6 to 17 | 1,496 | 67.6% | 4.7% |
| With own children 6 to 17 only | 2,975 | 79.8% | 2.9% |
Poverty status in the past 12 months
| Demographic characteristic | Total | Labor force participation rate | Unemployment rate |
|---|---|---|---|
| Below poverty level | 5,075 | 37.1% | 34.7% |
| At or above the poverty level | 33,556 | 75.6% | 3.7% |
Disability status
| Demographic characteristic | Total | Labor force participation rate | Unemployment rate |
|---|---|---|---|
| With any disability | 6,819 | 38.9% | 15.1% |
Educational attainment
| Demographic characteristic | Total | Labor force participation rate | Unemployment rate |
|---|---|---|---|
| Population 25 to 64 years | 36,136 | 69.3% | 5.2% |
| Less than high school graduate | 3,186 | 54.7% | 10.2% |
| High school graduate (includes equivalency) | 9,516 | 68.9% | 4.1% |
| Some college or associate's degree | 13,633 | 67.4% | 7.4% |
| Bachelor's degree or higher | 9,801 | 77.2% | 2.4% |
Source: U.S. Census Bureau, American Community Survey 5-year estimates, S2301 | Employment Status
This workforce product was funded by a grant awarded by the U.S. Department of Labor's Employment and Training Administration. The product was created by the recipient and does not necessarily reflect the official position of the U.S. Department of Labor. The Department of Labor makes no guarantees, warranties, or assurances of any kind, expressed or implied, with respect to such information, including any information on linked sites and including, but not limited to, accuracy of the information or its completeness, timeliness, usefulness, adequacy, continued availability, or ownership. This product is copyrighted by the institution that created it. Internal use by an organization and/or personal use by an individual for non-commercial purposes is permissible. All other uses require the prior authorization of the copyright owner.