

October 2025
August 2025 highlights
In August, the not seasonally adjusted monthly unemployment rate increased from 3.8% to 4.1%. Total nonfarm employment decreased by 2,100 jobs in the Wenatchee MSA from August 2024 to August 2025.
Summary
Chelan County’s labor supply was 41,842 workers as of August 2025, with a not seasonally adjusted unemployment rate of 4.1%. Total nonfarm employment in the Wenatchee metropolitan district was 48,000 jobs in August 2025, a decrease of 2,100 jobs from August 2024, and a decrease of 600 jobs from July 2025. Agriculture, forestry and fishing make up the largest industry sector with an annual average employment of 7,763 jobs out of 44,962 total annual average employment in 2024. Chelan County is the sixth largest producer of fruits, tree nuts and berries in the state. The county generates $261 million of revenue annually from these crops. There are 712 farms using 55,095 acres of land. The county has 3,126 establishments employing workers covered by the Washington State Employment Security Act. Chelan County’s 16 and older population was 63,416 in 2023.
Geography
Chelan County is located in the center of Washington. Lake Chelan is a local attraction. It is more than 50 miles long and is abutted by high mountain peaks.
Chelan County is part of the Wenatchee, WA Metropolitan Statistical Area (MSA), comprised of Chelan and Douglas counties. It is part of the SkillSource Workforce Development Area, covering north central Washington. Visit the Workforce Training & Education Coordinating Board website for information about Washington’s 12 workforce areas.
Employment situation for August 2025
Labor force and unemployment
- The not seasonally adjusted unemployment rate was 4.1% in August 2025, down from 4.9% in August 2024.
- The August 2025 labor force of 41,842 workers decreased by 592 from August 2024.
- The total number of employed workers was 40,128, a decrease of 234 workers from August 2024 to August 2025.
Unemployment rate, not seasonally adjusted
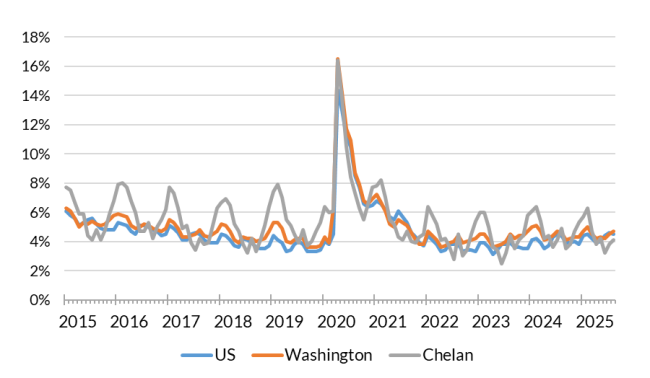
Source: Employment Security Department/Labor Market Information and Research Division, Local area unemployment statistics
Payroll employment, Wenatchee Metropolitan Statistical Area
- Total nonfarm employment was 48,000 jobs in August 2025. Total employment decreased by 600 jobs from July 2025 and decreased by 2,100 jobs from August 2024.
- Retail trade, at 6,200 jobs, decreased by 100 jobs from July 2025 and decreased by 300 jobs from August 2024.
- Leisure and hospitality, at 7,400 jobs, decreased by 100 jobs from July 2025 and decreased by 300 jobs from August 2024.
- Mining, logging and construction employment decreased by 200 jobs from August 2024 to August 2025 and now sits at 3,800 jobs.
- Private education and health services, at 8,800 jobs, remained unchanged from July 2025 to August 2025, but increased by 200 jobs from August 2024.
- Government, at 9,000 jobs, decreased by 400 jobs from July 2025 to August 2025, and decreased by 400 jobs from August 2024. Over the year, federal government jobs decreased by 100, and local government jobs decreased by 300.
Nonfarm employment estimates, not seasonally adjusted, Wenatchee MSA
| NAICS Industry Title | Aug 2025 (Prelim) | Jul 2025 (Revised) | Aug 2024 (Revised) | Jul 2025 to Aug 2025 Change | Aug 2024 to Aug 2025 Change | Aug 2024 to Aug 2025 % Change |
|---|---|---|---|---|---|---|
| Total nonfarm | 48,000 | 48,600 | 50,100 | -600 | -2,100 | -4.2% |
| Total private (total nonfarm less government) | 39,000 | 39,200 | 40,700 | -200 | -1,700 | -4.2% |
| Goods-producing | 6,500 | 6,500 | 7,100 | 0 | -600 | -8.5% |
| - Mining, logging and construction | 3,800 | 3,800 | 4,000 | 0 | -200 | -5.0% |
| - Manufacturing | 2,700 | 2,700 | 3,100 | 0 | -400 | -12.9% |
| Service-providing | 41,500 | 42,100 | 43,000 | -600 | -1,500 | -3.5% |
| - Trade, transportation, and utilities | 9,400 | 9,800 | 9,800 | -400 | -400 | -4.1% |
| - - Retail trade | 6,200 | 6,300 | 6,500 | -100 | -300 | -4.6% |
| - Private education and health services | 8,800 | 8,800 | 8,600 | 0 | 200 | 2.3% |
| - Leisure and hospitality | 7,400 | 7,500 | 7,700 | -100 | -300 | -3.9% |
| - Government | 9,000 | 9,400 | 9,400 | -400 | -400 | -4.3% |
Note: Data benchmarked through March 2025, updated Septmber 15, 2025.
Source: Employment Security Department/Labor Market Information and Research Division, Washington employment estimates (WA-QB & CES)
Detailed tables can be found on the source page in the third spreadsheet titled Current employment estimates, not seasonally adjusted.
Industry employment (covered employment)
Employment by industry, Chelan County 2024 annual average
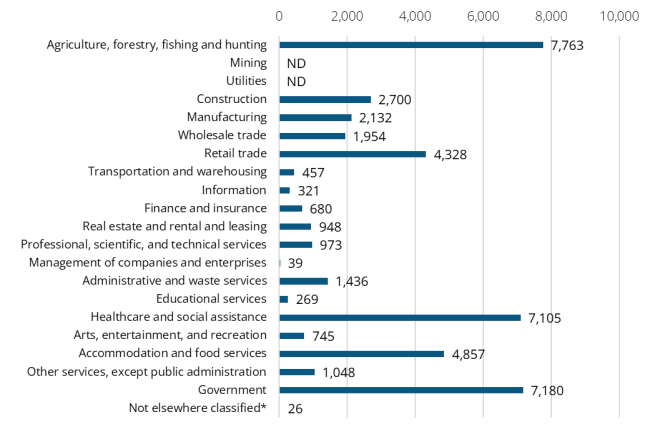
Note: ND stands for not disclosed. ND is used to avoid disclosing data for individual employers. Industries labeled ND are grouped in the Not elsewhere classified category.
Source: Employment Security Department/Labor Market Information and Research Division, Covered Employment (QCEW)
Average annual covered employment in 2024 in Chelan County was 44,962. Covered employment refers to workers who received wages in Washington state and are eligible for state and federal unemployment insurance (UI) compensation programs.
Top sectors in terms of employment in 2024:
- Agriculture (7,763)
- Government (7,180)
- Healthcare and social assistance (7,105)
- Accommodation and food services (4,857)
- Retail trade (4,328)
The average annual wage in Chelan County was $57,539, or 62.2% of Washington state’s average annual wage of $92,467.
Top sectors in terms of total wages paid in 2024:
- Government ($555.8 million)
- Health care and social assistance ($549.3 million)
- Agriculture, forestry, fishing and hunting ($286.7 million)
- Construction ($255.1 million)
- Retail trade ($167 million)
Workforce demographics for Chelan County
Chelan County’s 16 and older population was 63,416 in 2023 with an unemployment rate of 4.0%.
Visit the U.S. Census Bureau website for more quick facts about Chelan County.
Age
| Demographic characteristic | Total | Labor force participation rate | Unemployment rate |
|---|---|---|---|
| Population 16 years and over | 63,416 | 60.7% | 4.0% |
| 16 to 19 years | 3,693 | 42.5% | 11.9% |
| 20 to 24 years | 4,515 | 82.3% | 8.6% |
| 25 to 29 years | 4,772 | 88.0% | 1.7% |
| 30 to 34 years | 4,990 | 86.2% | 5.7% |
| 35 to 44 years | 10,009 | 84.9% | 2.8% |
| 45 to 54 years | 8,615 | 84.1% | 3.8% |
| 55 to 59 years | 4,923 | 73.2% | 2.2% |
| 60 to 64 years | 5,608 | 53.9% | 1.5% |
| 65 to 74 years | 9,771 | 20.2% | 3.7% |
| 75 years and over | 6,520 | 5.6% | 0.0% |
Race or Hispanic origin
| Demographic characteristic | Total | Labor force participation rate | Unemployment rate |
|---|---|---|---|
| White alone | 46,524 | 55.6% | 3.8% |
| Black or African American alone | 324 | 63.3% | 13.7% |
| American Indian and Alaska Native alone | 788 | 77.3% | 2.5% |
| Asian alone | 561 | 67.4% | 0.0% |
| Native Hawaiian and other Pacific Islander alone | 62 | 59.7% | 0.0% |
| Some other race alone | 9,076 | 74.3% | 3.5% |
| Two or more races | 6,081 | 76.5% | 5.7% |
| Hispanic or Latino origin (of any race) | 14,990 | 76.6% | 4.8% |
| White alone, not Hispanic or Latino | 45,216 | 55.2% | 3.6% |
| Population 20 to 64 years | 43,432 | 79.6% | 3.7% |
Sex
| Demographic characteristic | Total | Labor force participation rate | Unemployment rate |
|---|---|---|---|
| Male | 21,984 | 84.4% | 4.3% |
| Female | 21,448 | 74.7% | 3.0% |
Females with children
| Demographic characteristic | Total | Labor force participation rate | Unemployment rate |
|---|---|---|---|
| With own children under 18 | 7,781 | 76.9% | 3.6% |
| With own children under 6 only | 1,710 | 69.9% | 1.1% |
| With own children under 6 and 6 to 17 | 1,657 | 73.3% | 1.8% |
| With own children 6 to 17 only | 4,414 | 80.9% | 5.0% |
Poverty status in the past 12 months
| Demographic characteristic | Total | Labor force participation rate | Unemployment rate |
|---|---|---|---|
| Below poverty level | 3,491 | 39.7% | 15.6% |
| At or above the poverty level | 39,716 | 83.5% | 3.2% |
Disability status
| Demographic characteristic | Total | Labor force participation rate | Unemployment rate |
|---|---|---|---|
| With any disability | 6,267 | 56.5% | 5.2% |
Educational attainment
| Demographic characteristic | Total | Labor force participation rate | Unemployment rate |
|---|---|---|---|
| Population 25 to 64 years | 38,917 | 79.3% | 3.1% |
| Less than high school graduate | 6,209 | 75.7% | 6.3% |
| High school graduate (includes equivalency) | 8,682 | 76.7% | 2.4% |
| Some college or associate's degree | 12,585 | 78.1% | 2.8% |
| Bachelor's degree or higher | 11,441 | 84.6% | 2.2% |
Source: U.S. Census Bureau, American Community Survey 5-year estimates, S2301 | Employment Status
This workforce product was funded by a grant awarded by the U.S. Department of Labor's Employment and Training Administration. The product was created by the recipient and does not necessarily reflect the official position of the U.S. Department of Labor. The Department of Labor makes no guarantees, warranties, or assurances of any kind, expressed or implied, with respect to such information, including any information on linked sites and including, but not limited to, accuracy of the information or its completeness, timeliness, usefulness, adequacy, continued availability, or ownership. This product is copyrighted by the institution that created it. Internal use by an organization and/or personal use by an individual for non-commercial purposes is permissible. All other uses require the prior authorization of the copyright owner.