English | Español
QUICK LINKS
LMI HOMEPAGE
FREQUENTLY USED LINKS
TECHNICAL TOOLS AND STEM
EMPLOYMENT
UNEMPLOYMENT
WAGE
PAID FAMILY AND MEDICAL LEAVE
REPORTS AND RESEARCH
Labor Market and Credential Data Dashboard
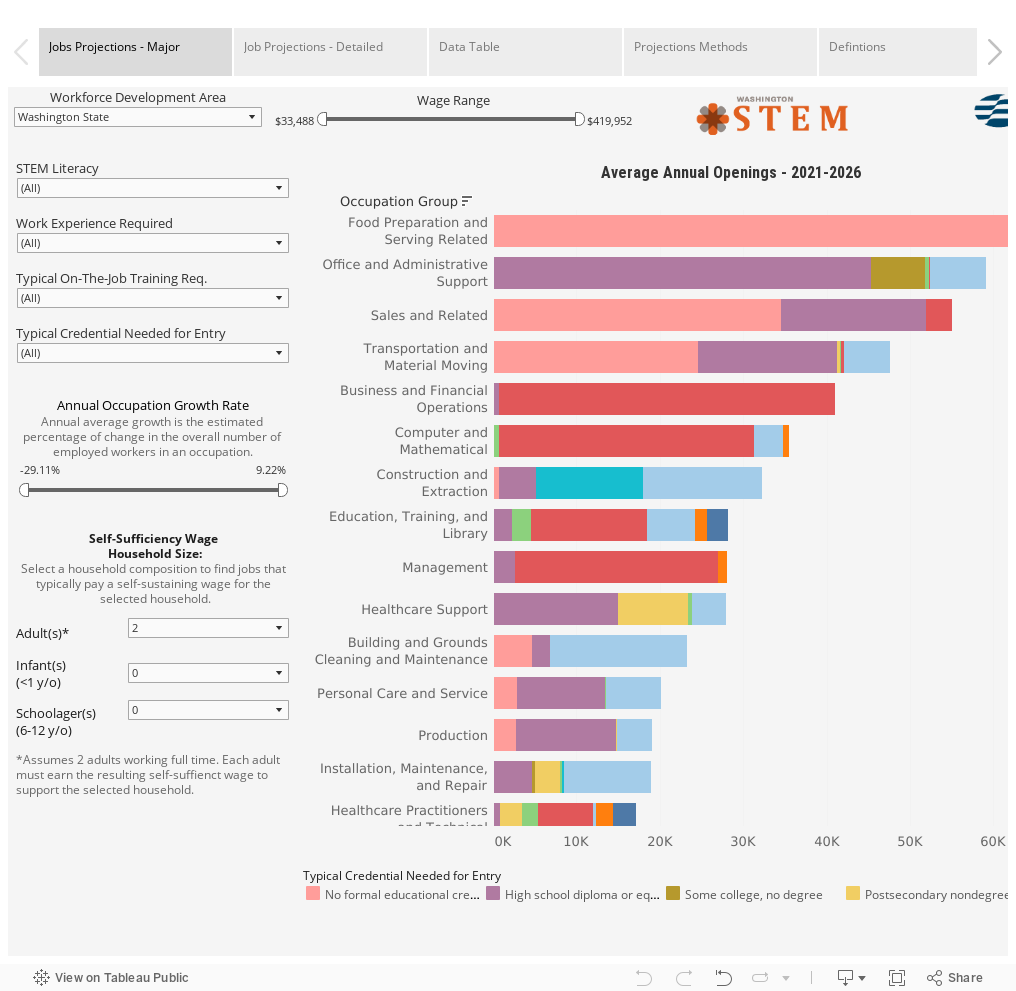
Washington STEM originally developed this data dashboard by using ESD employment projections and occupational wage estimates and combined those data with other sources to help inform job seekers in each region of the state. ESD and Washington STEM partnered to create this version of the dashboard in the Spring of 2023.
Whether you are looking for a new job, considering a mid-career transition, or evaluating your education options, labor market information can be a valuable part of an informed decision-making process. This data dashboard combines three critical elements that factor into an informed career decision: anticipated growth in your area, typical education level needed, and average wage earned in that occupation.
Use this data dashboard to explore your local labor market, and how you fit into that big picture.
How to use the Labor Market and Credential Data Dashboard
Focus on a region. In the "Jobs Projections - Major Groups" tab, start by selecting a workforce development area (WDA).
Step 1
Click "Full Screen" in the bottom right hand corner of the dashboard
Step 2
Use the filters at the top to sort and narrow down the data.
Step 3
Click "Revert" in the bottom left-hand corner to reset to default filter selections.
Additional tool tips
Self-sufficiency wage
In the "Jobs Projections - Major Groups" tab, selecting a family composition will filter results to exclude occupations typically offering below the selected self-sufficient wage. The minimum occupation wage can also be manually adjusted by using the slider below "Regional Medium Wage."
Navigate the tabs
In the "Jobs Projections - Major Groups" tab, clicking on a group label will populate a visualization on the "Jobs Projections - Detailed" tab that separates out all of the jobs within that group. Clicking on the "Data Table" tab will show the same data in a tabular, sortable format.
Download the data
Filter the data as appropriate for your question. Exit the full screen view, click on a data field in the data table, then click "Download" in the bottom right-hand corner. Select "Crosstab," then download the file.
This data visualization was created by Washington STEM, and utilizes projections and wage data published by the Employment Security Department. Washington STEM and ESD have partnered to make this tool available to all Washingtonians. We are grateful for our ongoing partnership. The Washington STEM version of this tool can be found here. We ask that any reference or images to this data include a citation to both Washington STEM and Employment Security Department of Washington.