English | Español
QUICK LINKS
LMI HOMEPAGE
FREQUENTLY USED LINKS
TECHNICAL TOOLS AND STEM
EMPLOYMENT
UNEMPLOYMENT
WAGE
PAID FAMILY AND MEDICAL LEAVE
REPORTS AND RESEARCH
Projections
Employment projections provide job seekers, policy makers and training providers an idea of how many jobs exist within industries and occupations, how the number of jobs are expected to change over time and what the future demand for workers will be.
Our projections show expected change in employment by industry and occupation, the current and projected employment counts, estimated growth rates and average annual openings.
We develop short-, medium- and long-term projections.
- Short-term projections are two-year projections.
- Medium-term projections are five-year projections.
- Long-term projections are 10-year projections.
We revise the projections annually.
How are employment projections developed?
We develop industry projections and convert them to occupations based on staffing patterns gleaned from occupational employment statistic surveys. The occupations-industry matrix displays occupational compositions for each industry for Washington state and Workforce Development Areas. The matrix is created for occupational projections and is based upon an occupational employment statistics (OES) survey. Industry classification is based on industry control totals (ICT) definitions.
Separations and alternative methods:
Average annual job openings
In our occupational employment projections, we present two sets of estimates for average annual job openings. One set is calculated using the job opening rates the Bureau of Labor Statistics (BLS) provides and the other one using Washington state specific job opening rates that ESD creates. The former are referred as BLS occupational separations rates and the latter as Washington state alternative occupational rates.
BLS occupational separations method
The separations method measures job openings created by workers who leave occupations and need to be replaced by new entrants. This method data is based on national survey data. In this method, workers who exit the labor force or transfer to an occupation with a different Standard Occupational Classification (SOC) are identified as generating separations openings at the national level. This means that jobs filled by interstate movement, when workers stay within occupations, are not identified as new jobs.
More detailed information about the separation approach can be found at:
Click here for separations information.
This BLS method does not track turnover within occupations. Turnovers within occupations occur when workers stay in occupations, but change employers.
Washington state alternative occupational method
Beginning with the 2017 projections cycle, ESD created a new Washington state specific alternative occupational method to the BLS separations method. The objective was to also track job openings due to workers transferring within occupations. For simplicity we refer to this method as the alternative method and to the rates as the alternative rates.
The alternative method is based on Washington state wage records, making the resulting alternative rates specific to Washington state.
The alternative rates track openings created by turnover within occupations (i.e. workers stay within occupations but transfer to different companies) and when workers leave one occupation for another or leave the workforce.
The method consists of three major steps:
- Estimating the total number of annual industry transfers that include:
- Transfers between industries
- Transfers inside industries
- New individuals in Washington state wage records (wage file)
- Exits or individuals who are no longer in the wage file
- Converting industry transfers to occupational transfers using occupation-to-industry staffing patterns (shares of occupations for each industry).
- Calculating alternative rates as total transfers, minus growth or decline, divided by estimated occupational employment for a base period.
The Quarterly Census of Employment and Wages program reclassified NAICS codes at the end of December 2021. The industry ‘Sub Sector’ most impacted by the administrative change was Management of companies and enterprises. At the start of January 2022, QCEW moved employment out of NAICS 4541 (Electronic shopping and mail-order houses) into NAICS 5511 (Management of companies and enterprises).
Occupational projections 2023
- Short-term occupational projections (alternative state specific)
- Long-term occupational projections (alternative state specific)
- All occupational projections (separations)
- All occupational projections (alternative state specific)
Industry projections 2023
- Short-term industry projections (aggregated)
- Long-term industry projections (aggregated)
- All industry projections (aggregated)
Control totals and matrices 2023
- Short-term industry control totals (detailed)
- Long-term industry control totals (detailed)
- All industry control totals (detailed)
- Occupations-industry matrices
Projections methodology
An extended explanation of the data, software and employment projections methodology can be found in the technical report.
Report data 2023
- All industry codes file
- Hybrid Standard Occupational Classification crosswalk
- Related occupational skills file
- Wages by education
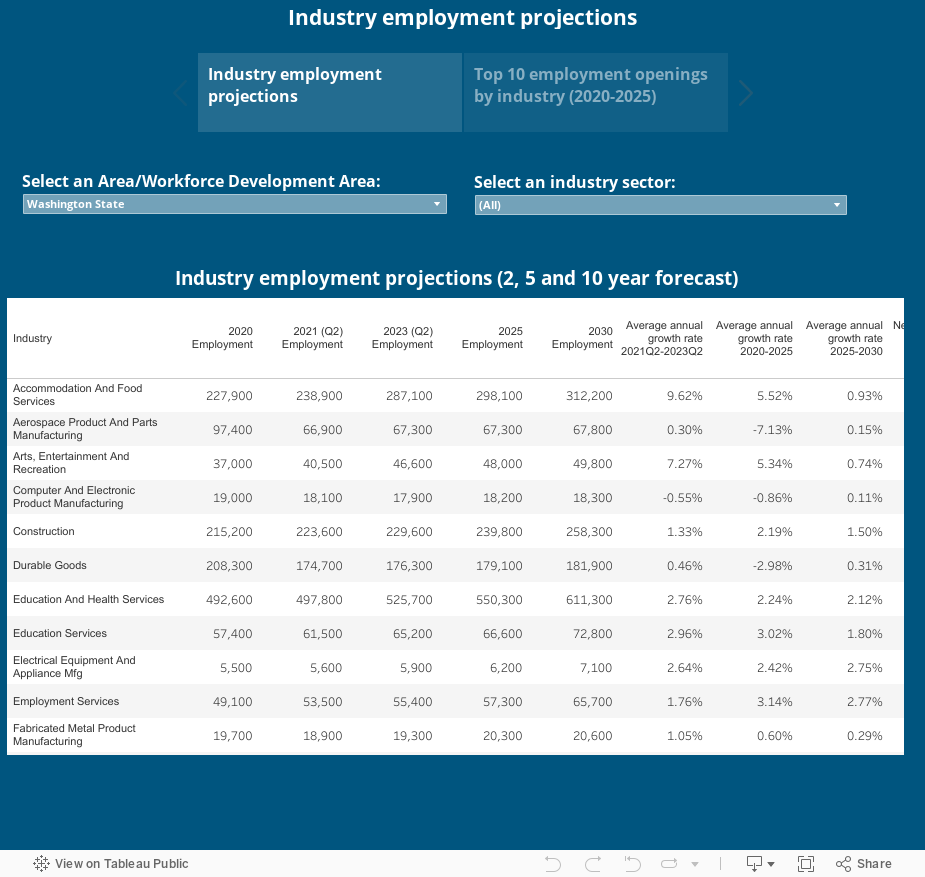
Industry Employment Projections data visualization 2023
This workforce product was funded by a grant awarded by the U.S. Department of Labor’s Employment and Training Administration. The product was created by the recipient and does not necessarily reflect the official position of the U.S. Department of Labor. The Department of Labor makes no guarantees, warranties, or assurances of any kind, expressed or implied, with respect to such information, including any information on linked sites and including, but not limited to, accuracy of the information or its completeness, timeliness, usefulness, adequacy, continued availability, or ownership. This product is copyrighted by the institution that created it. Internal use by an organization and/or personal use by an individual for non-commercial purposes is permissible. All other uses require the prior authorization of the copyright owner.